Notion's Analytics: A Product-First Tracking Plan
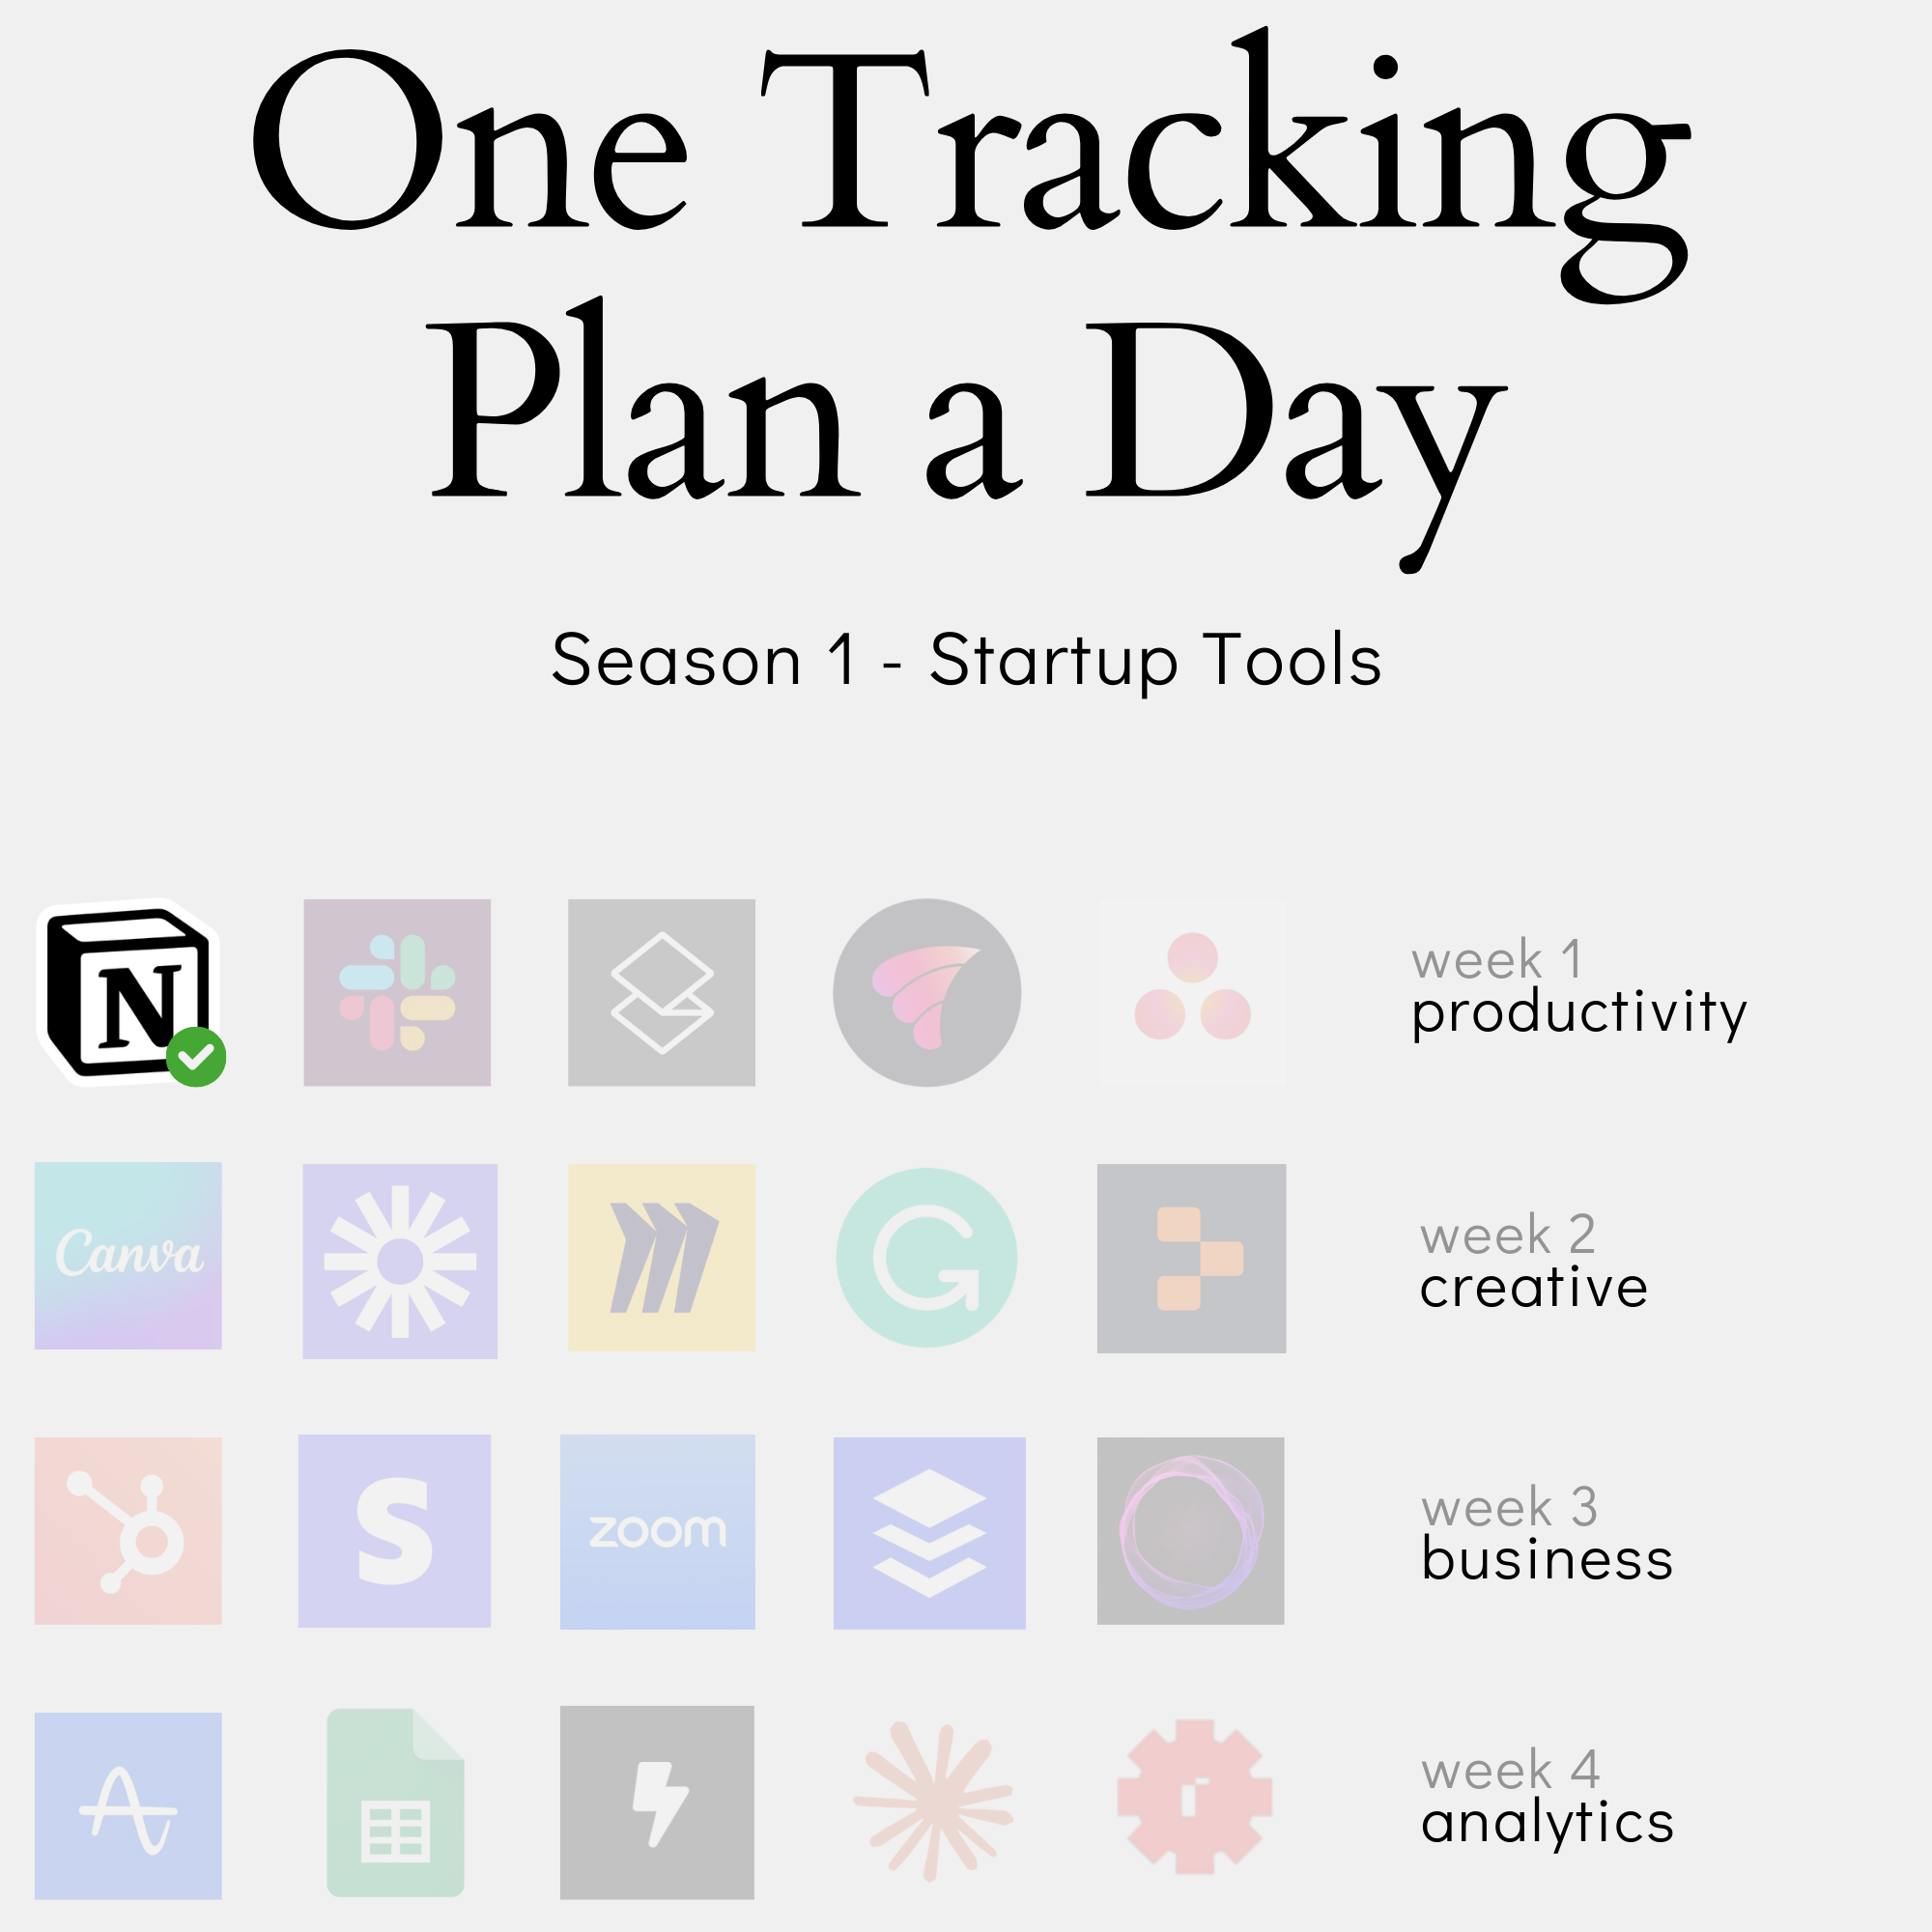
In this content series - season 1, I create a tracking plan for a typical start-up tool every day for four weeks (I take a break on the weekend), so 20 in total. This is the first one for the omnipresent Notion tool. You can apply the principles in this one to any tool that has workspaces and documents. Here is the season overview:
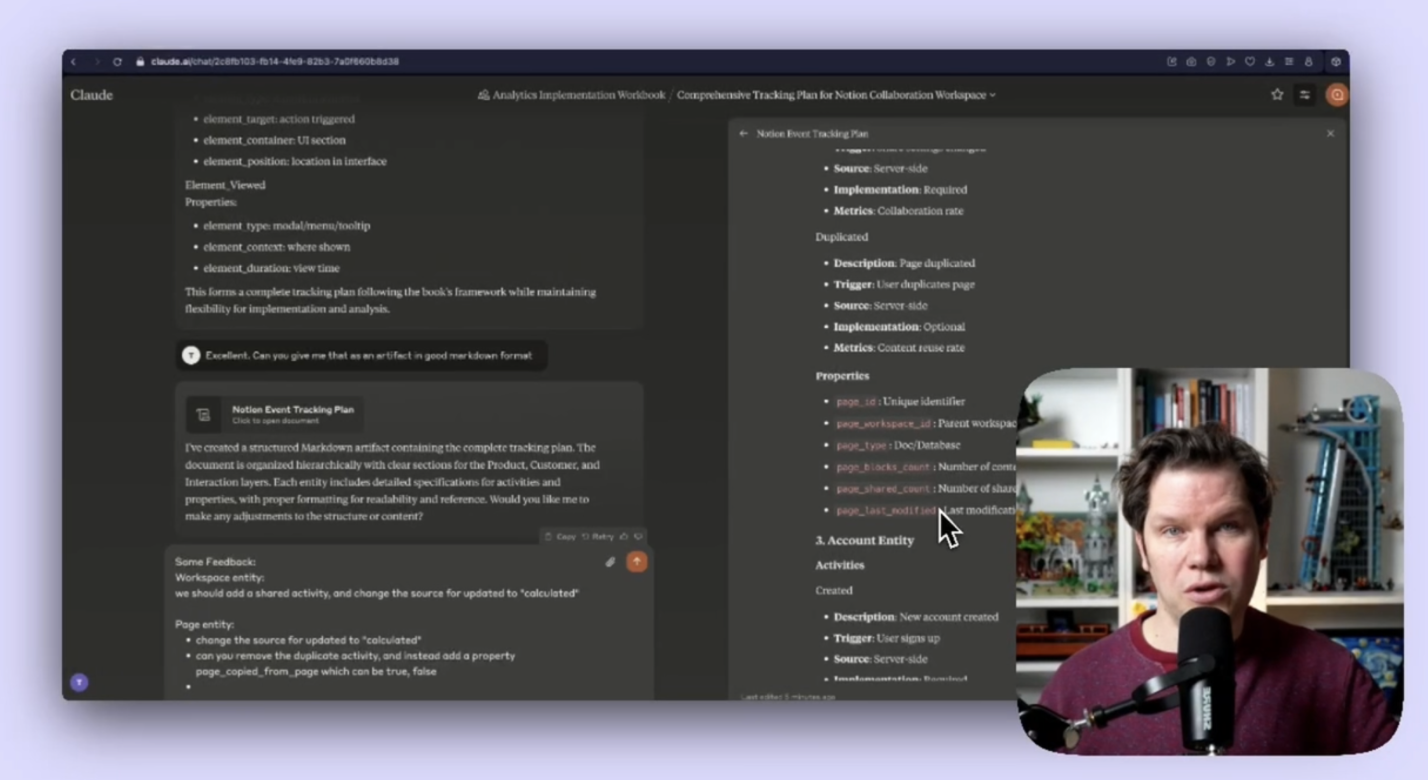
Every product analytics implementation starts with good intentions and ends in event chaos.” This was my experience at every company until I developed a structured approach to building tracking plans. Today, we’ll explore how to create a foundational analytics framework for Notion using AI assistance - a process that helps avoid common pitfalls while capturing meaningful user behavior. Instead of tracking every click, we’ll focus on what really matters: how users progress from exploration to active usage, and ultimately, to product success.
The approach combines systematic event design with practical decision-making, demonstrating how thoughtful analytics architecture can scale with your product. Whether you’re building Notion, another collaboration tool, or any SaaS product, these principles will help you create analytics that drives genuine product insights.
This is part 1 of my new content series, where I will create one tracking plan each day for the next four weeks (I will pause on the weekends).
From Raw Events to Customer Journey: The Double Three-Layer Framework
When building analytics for a product like Notion, it’s tempting to track everything. Every click, every view, every interaction. Yet the most valuable insights often come from understanding user behavior at a higher level. This requires a different approach to event tracking – one that focuses on meaningful activities rather than raw interactions.
This work is based on the chapters about event data design in my book Analytics Implementation Workbook. There, you can read more details about the D3L framework.
But follow along for now to see how we use it in practice.
Moving Beyond Individual Events
Most analytics implementations start with tracking clicks, page views, and button interactions. While this data captures user behavior, it often creates a deluge of disconnected events that fail to answer crucial business questions: Are users getting value? How do they progress through the product? Which features drive retention?
The problem isn’t just volume – it’s structure. When tracking focuses on interactions, you end up with hundreds of unique events that describe how users navigate your interface rather than how they achieve their goals. This makes it nearly impossible to identify patterns that matter for product decisions.
Consider Notion’s “Share” functionality. A traditional approach might track:
- “share_button_clicked”
- “share_modal_opened”
- “email_input_changed”
- “share_confirmed”
But what really matters is that a user successfully shared content with others – a key value moment that indicates collaboration.
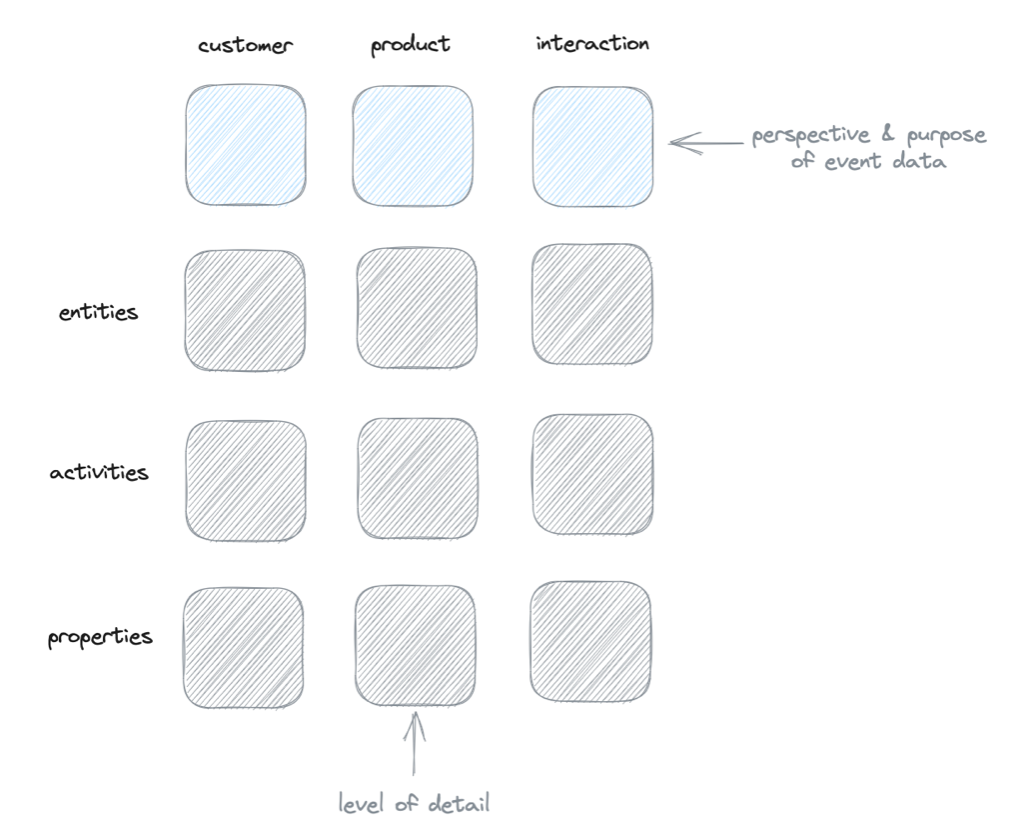
This is why we need to move beyond individual events to a structured framework that captures product usage at different levels of abstraction. The Double Three-Layer Framework provides this structure, organizing events into meaningful layers that connect user actions to business outcomes.
If you prefer to watch, here is my YouTube video where I describe everything:
The First Three Layers: Event Types
The Double Three-Layer Framework organizes events into three distinct types, each serving a specific purpose in understanding product usage:
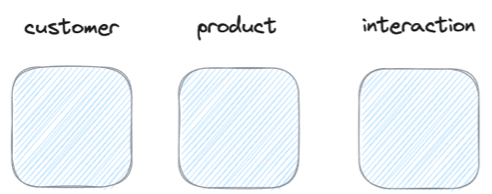
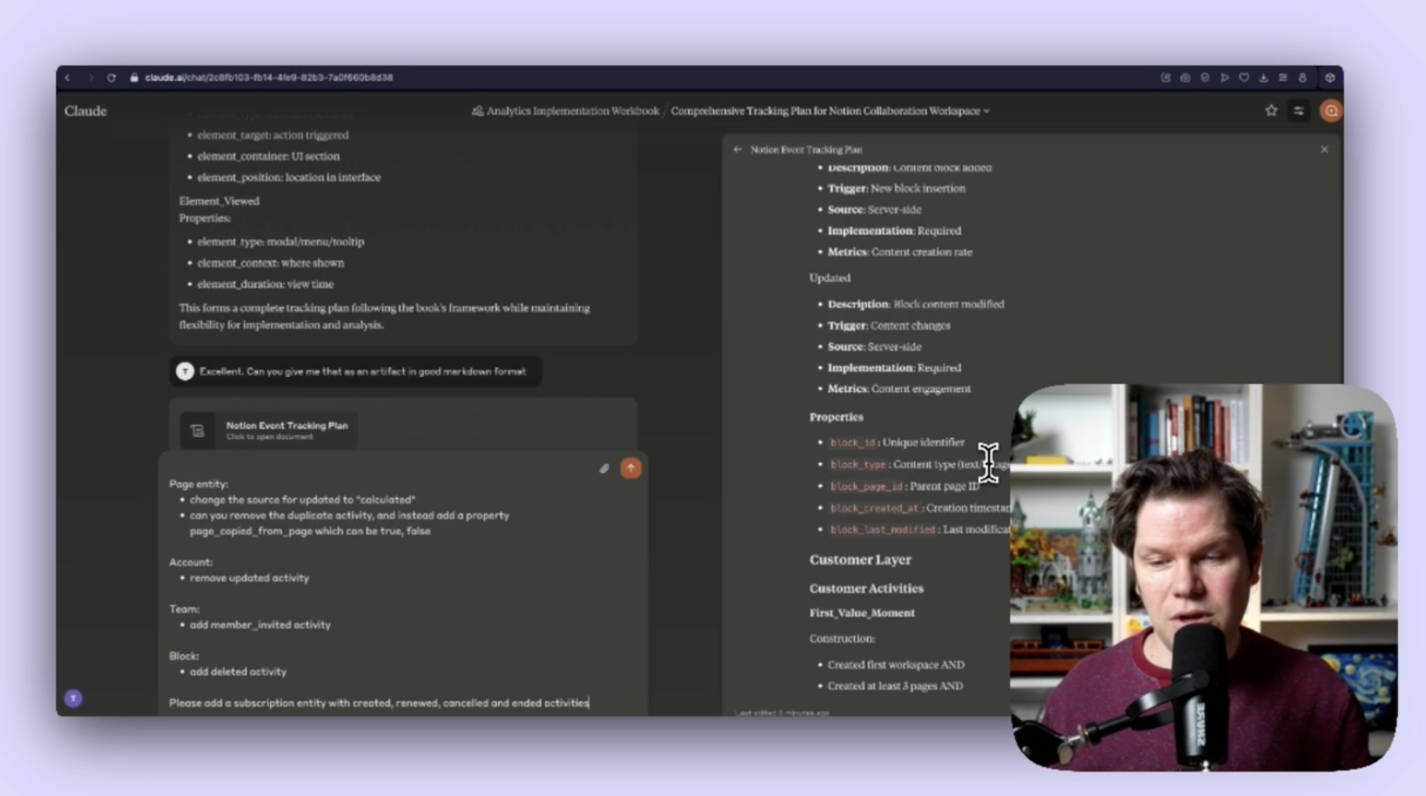
Product Events capture core product functionality at an abstract level. For Notion, these include activities like “workspace_created”, “page_shared”, or “block_added”. They represent meaningful product interactions without getting lost in interface details. These events form the backbone of your analytics, tracking how users utilize key product capabilities.
Customer Events track progression through the product lifecycle. Instead of individual actions, they capture important states like “first_value_achieved” (created workspace, added pages), “became_active_user” (regular content creation), or “at_risk” (declining engagement). These events help measure activation, engagement, and potential churn by focusing on the user’s journey rather than their clicks.
Interaction Events serve as a catchall for interface-level tracking needs. Rather than creating unique events for every button, we use generic events like “element_clicked” with properties describing what was clicked. This provides interface insights when needed while keeping the event schema clean and maintainable.
This layered approach ensures we capture both high-level product adoption and detailed usage patterns without mixing different types of user behavior.
The Second Dimension: Components
The framework’s second dimension breaks down each event type into three key components:
Entities represent standalone objects in your product that users interact with. For Notion, core entities include workspaces, pages, accounts, and teams. Each entity should be significant enough to warrant tracking independently. The subscription entity, for example, merits separate tracking because it bridges product usage and business metrics.
Activities describe what happens to entities. They capture meaningful state changes like “created”, “shared”, or “deleted”. When designing activities, less is more – each should represent a distinct, valuable action. For instance, rather than tracking every page edit, we might only track significant changes through a “last_modified” property.
Properties provide context for entities and activities. They include identifiers (workspace_id), characteristics (page_type), and calculated metrics (blocks_count). Properties help segment and analyze behavior without creating new events for every variation. They’re also easier to add later without restructuring your tracking implementation.
These components create a structured vocabulary for describing product usage, making analytics both powerful and maintainable.
How The Layers Work Together
Let’s see how these layers work together by following a single user action in Notion:
A user creates a new page in their workspace. At the interaction level, this might involve clicking “New Page” and typing a title. Rather than tracking these individual clicks, we capture a single product event: “page_created”. This event includes properties like page_id, workspace_id, and page_type.
This same action contributes to customer events tracking the user’s journey. Combined with other actions like adding content and sharing, it might trigger “first_value_achieved” or contribute to “became_active_user” status. The framework connects individual product usage to meaningful progression.
The three layers provide different lenses for analysis:
- Product events show what users do
- Customer events reveal how they progress
- Interaction events explain how they navigate
By structuring events this way, we can answer both tactical questions (“How are users creating pages?”) and strategic ones (“Are users becoming successful?”) without drowning in event data.
Building the Foundation: Core Entities and Activities for Notion
Core Entities for a Foundational Plan
When building Notion’s foundational tracking plan, we focus on five core entities that form the backbone of user activity:
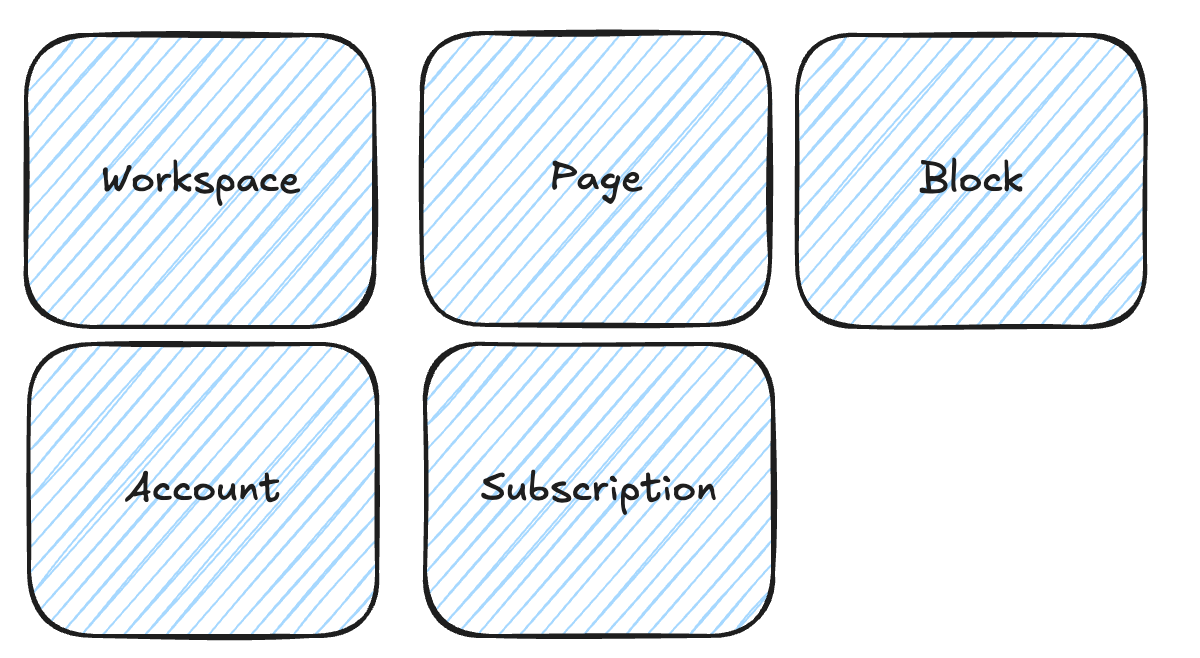
Workspace serves as the primary container entity. It’s where collaboration happens and content lives. Tracking workspace creation, sharing, and overall usage provides insights into adoption and team collaboration patterns.
Pages represent the main content entity. Users create, organize and share pages to capture knowledge. Page-level tracking helps measure content creation and collaboration frequency.
Account tracks individual user identity and settings. This entity connects user actions across workspaces and enables cohort analysis based on user properties.
Team enables tracking of collaborative usage. Team metrics like member count and activity levels indicate product stickiness and expansion opportunities.
Subscription bridges product usage with business metrics. Tracking subscription states (created, renewed, canceled) connects user behavior to revenue outcomes.
Each entity requires a unique identifier and timestamps for created/modified dates. This foundation enables tracking key product flows while maintaining flexibility for future expansion.
Defining Key Activities
The key activities for each entity create a map of essential user behaviors in Notion:
Workspace Activities
- Created: Initial workspace setup
- Shared: Opening collaboration
- Updated: Activity heartbeat
- Deleted: Workspace removal
Page Activities
- Created: New content addition
- Shared: Content distribution
- Updated: Content changes
- Deleted: Content removal
Account Activities
- Created: User onboarding
- Subscription_changed: Plan modifications
Team Activities
- Created: Team formation
- Member_added: Team growth
- Deleted: Team dissolution
Subscription Activities
- Created: Initial subscription
- Renewed: Continued engagement
- Cancelled: Churn signal
- Ended: Revenue impact
Each activity represents a meaningful state change rather than interface interactions. This focused set of activities enables tracking core product usage while avoiding event proliferation.
Essential Properties
Properties provide essential context for entities and activities in Notion’s analytics:
Identifiers and Relationships
- {entity}_id: Unique identifiers for each entity
- parent_id: Links pages to workspaces
- user_id: Connects actions to accounts
- team_id: Enables team-level analysis
Calculated Metrics
- members_count: Team/workspace size
- blocks_count: Content volume
- pages_count: Workspace activity
- shared_count: Collaboration level
Status Indicators
- page_type: Document vs database
- subscription_status: Active/canceled
- sharing_level: Private/team/public
- last_modified: Recent activity
These properties enable segmentation and analysis without requiring new events for each variation. They can be enriched over time as analytics needs evolve.
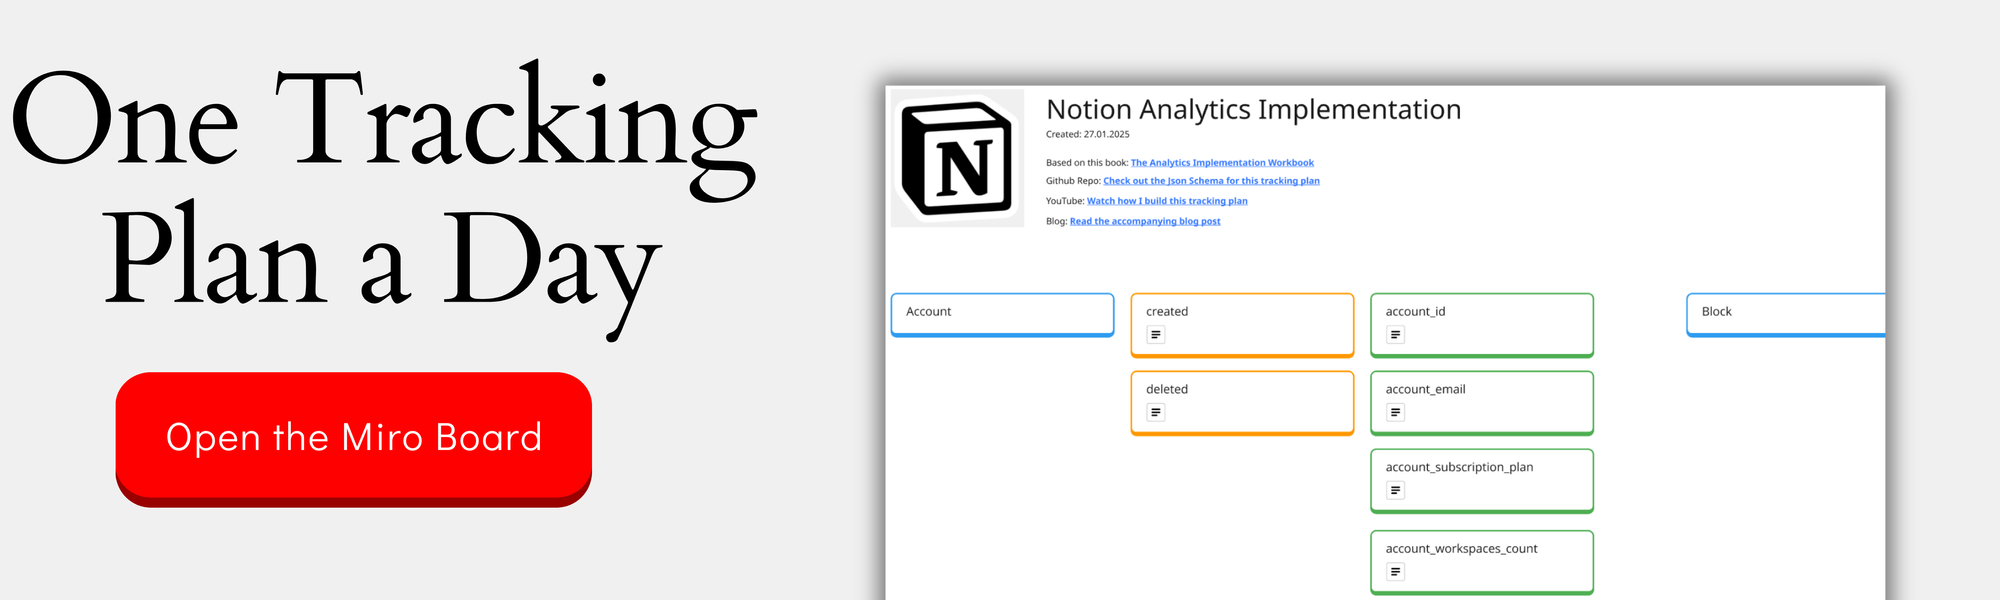
You can check out the complete design on the Miro Board:
Implementation Priorities
Starting with fundamental flows ensures successful implementation while maintaining flexibility for growth:
Priority 1: Core Creation & Sharing
- Workspace and page creation tracking
- Basic sharing functionality
- Team member additions
- Account creation and subscription starts
Priority 2: Value Indicators
- Content creation frequency
- Collaboration patterns
- Team engagement levels
- Basic retention metrics
Priority 3: Growth Foundations
- Subscription tracking
- Team expansion monitoring
- Workspace growth patterns
- Member activation rates
This tiered approach ensures essential metrics are captured first while laying groundwork for more sophisticated analysis. Each tier builds upon previous implementation, allowing validation of tracking quality before expanding scope.
Key success metrics can be tracked from launch, with additional granularity added as usage patterns emerge.
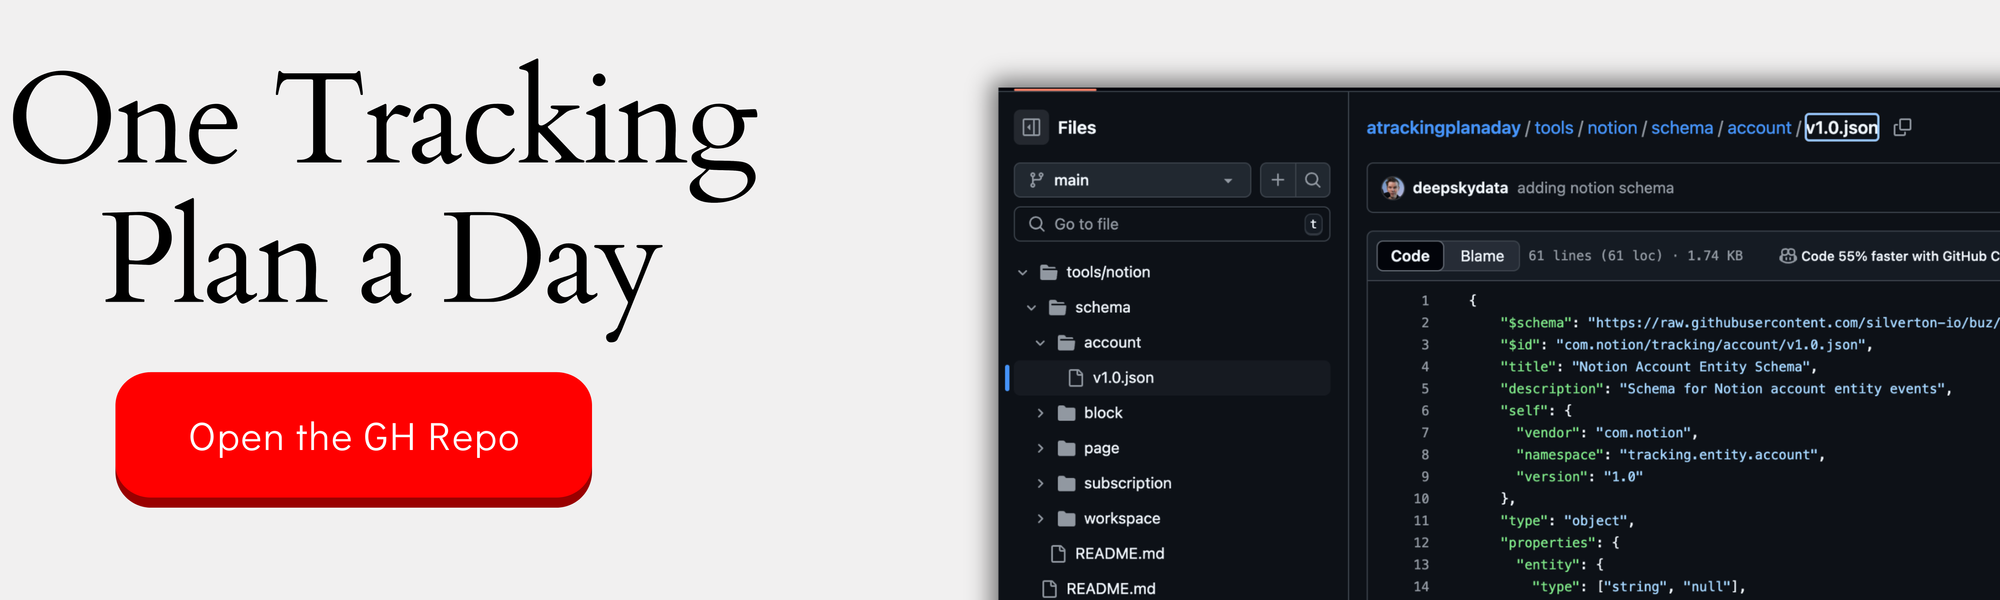
If you want the nerdy version, you can check out the JSON schemas here:
Evolution Path
The tracking plan should evolve systematically as product usage grows:
Adding New Entities
- When feature sets become complex enough to warrant independent tracking
- If new collaboration models emerge
- When monitoring new business dimensions becomes critical
- But beware - entities are holy and make one of they really deserve to be one
Expanding Activities
- Add activities when usage patterns reveal new success indicators
- Introduce granular tracking for heavily-used features (carefully)
- Track new conversion points as user journeys evolve
Property Enrichment
- Add calculated metrics as analysis needs mature
- Introduce new segmentation dimensions
- Enhance context based on observed usage patterns
- Always think about first adding a property when you want to change something, then about activities if properties don’t work
Feature Expansion Guidelines
- Maintain clean event taxonomy
- Evaluate whether new features warrant entity status
- Consider property additions before creating new events
- Validate data quality before expanding scope
This evolution maintains analytics clarity while supporting product growth.
Rule #1: Every newly introduced event (entity + activity) is causing more work (implementation, monitoring, documentation, data user experience, potential confusion)
If you prefer to watch this in a more course-like setting, with helpful context and you would like to see a free preview of my upcoming course, Analytics Implementation Deep Dive, check out this link:
Design in Practice: Three Critical Event Tracking Decisions
Decision 1: Managing State Changes
The “Updated” event represents one of the most crucial design decisions in event tracking. For Notion, this manifests in three key scenarios:
Workspace/Page Updates
- Initial inclination: Track every content change with an update activity
- Better approach: Use last_modified timestamp
- Rationale: Reduces event volume while maintaining activity insight
State Changes vs Properties
- Example: Page sharing levels
- Decision: Track “page_shared” event with sharing_level property
- Alternative rejected: Separate events for each sharing state
- Benefit: Maintains clean event schema while preserving analysis flexibility
Activity Heartbeat
- Challenge: Tracking ongoing engagement
- Solution: Use calculated activity metrics based on last_modified
- Implementation: Update timestamp on significant changes only
- Advantage: Enables activity monitoring without event spam
This approach balances granular tracking needs with system maintainability.
Decision 2: Subscription Tracking Approaches
The subscription tracking decision balances technical implementation with business insights:
Standalone Entity Approach (Selected)
- Distinct subscription events (created, renewed, canceled, ended)
- Properties for plan type, amount, billing period
- Enables clear subscription lifecycle tracking
- Supports revenue analysis and cohort tracking
Account Property Alternative (Rejected)
- Track as account state changes
- Single “subscription_changed” event
- Limited visibility into subscription patterns
- Harder to analyze retention metrics
Implementation Trade-offs
- More setup work for standalone entity
- Cleaner data model long-term
- Better supports pricing changes
- Enables subscription-specific metrics
This approach prioritizes analytical flexibility over initial simplicity.
Decision 3: Activity Calculation Methods
When tracking key activities in Notion, we face three core calculation approaches:
Real-time Events
- Track as actions occur
- Immediate data availability
- Higher implementation complexity
- Example: page_created, workspace_shared
- Could also be implemented via a server-side approach
Calculated Properties
- Derived from other events/properties
- Reduced event volume
- More flexible for definition changes
- Example: the workspace_active property based on last_modified property
Technical considerations guide timing:
- Calculated properties should be pre-calculated at the backend and not be calculated on the fly
- Query performance impacts - this is the same as with calculated properties, talk to the devs about if any properties will cause any performance issues. Moving things to the server side can be a solution.
- Implementation complexity - there is always a trade-off to make. If specific events or properties are causing problems, determine if they are worth the effort.
Lessons from These Decisions
Three key principles emerge from our tracking design decisions at Notion. First, favoring properties over events proves valuable when state changes happen frequently or when analysis needs remain exploratory. Rather than creating unique events for every state change, using properties provides analytical flexibility while maintaining a clean event structure. This approach particularly shines when tracking features that may evolve frequently, like sharing permissions or content types.
Balancing precision with maintenance forms our second key lesson. While comprehensive tracking might seem ideal, it often creates long-term maintenance challenges. By leveraging timestamps and calculated metrics, we can derive insights without overwhelming our tracking implementation. This approach enables us to answer complex questions about user behavior without requiring engineers to instrument every possible interaction.
Future-proofing our implementation represents our final lesson. Starting with core entities and using properties for variation creates a foundation that can grow with the product. This approach supports multiple analysis methods without requiring fundamental schema changes. As Notion’s feature set expands, we can add new properties or calculated metrics without disrupting existing analytics. This flexibility proves invaluable as product analytics needs evolve.
Beyond Features: Measuring Success Through User States and Activities
User States in Product Analytics
In Notion’s analytics framework, we define five key user states that track progression through the product lifecycle:
New Users: Accounts created within the current period. This state captures users starting their journey, typically lasting 30 days from signup.
Activated Users: Those who’ve achieved initial success markers:
- Created first workspace
- Added 3+ pages
- Created 10+ content blocks These criteria indicate basic product understanding.
Active Users: Demonstrate ongoing engagement through:
- Content creation in 3+ days per week
- Regular sharing activity
- Team collaboration Time windows adjust based on expected usage patterns.
At Risk Users: Show declining engagement:
- No activity in last 14 days
- Reduced team collaboration
- Dropping below active criteria Early warning system for potential churn.
Dormant Users: Effectively churned from product usage:
- No activity in 30+ days
- Team members inactive
- No content changes Distinguished from subscription churn.
Users can move between states based on activity patterns, creating measurable progression through the product lifecycle.
Mapping Product Activities to States
Activities in Notion map directly to user states, creating clear progression signals:
Activation Signals
- First workspace creation
- Initial page structuring
- Team member invitations
- First content share These early activities predict long-term engagement.
Active Usage Indicators
- Regular page creation
- Consistent content updates
- Cross-page linking
- Team collaboration Frequency matters more than volume.
Risk Signals
- Declining creation frequency
- Reduced sharing activity
- Team member inactivity
- Fewer page updates Two-week window provides intervention opportunity.
Churn Predictors
- No workspace activity
- Team communication drop
- Static content
- Missing key features Early detection enables retention efforts.
Each state transition requires specific activity combinations within defined timeframes, enabling automated state tracking and proactive engagement strategies.
Creating Actionable Metrics
User state metrics reveal Notion’s product health and growth trajectory:
State Transition Rates
Monitor key conversion points:
- New to Activated: Target 40%+ in first 30 days
- Activated to Active: Weekly progression rates
- Active to At Risk: Alert when exceeding 20%
- Recovery from At Risk: Intervention success rate
Time windows matter. Most users activate within 7 days or not at all. Active state duration predicts long-term retention.
Retention Analysis
Track retention through state transitions:
- Active retention by signup cohort
- Team size correlation
- Feature adoption impact
- Usage pattern differences
Growth indicators emerge from state progressions. Workspace expansion follows activation. Team collaboration depth predicts retention strength.
These metrics connect daily product usage to quarterly business outcomes. Weekly monitoring enables rapid intervention when metrics decline.
Using States for Product Decisions
User states drive product development priorities by revealing key opportunities:
Friction Points
Early state transitions expose friction. Low activation rates point to onboarding challenges. Team invitation drop-offs signal collaboration barriers.
Activation Optimization
Monitor first value achievement:
- Simplify workspace creation
- Guide initial content structure
- Accelerate team connection Track improvement impact through activation rates.
Retention Focus
State patterns guide feature priorities:
- At-risk prevention features
- Active user engagement tools
- Reactivation capabilities
Product roadmap aligns with state progression needs. New features target specific state transitions. Success metrics tie directly to state improvements.
Track feature impact through state transition changes. Strong features move users toward active states. Weak ones show minimal state progression impact.
Building analytics isn’t just about collecting data – it’s about creating a foundation for product understanding. We enable insights that drive product decisions by structuring our tracking around user states and meaningful activities rather than interface interactions. The framework we’ve explored for Notion demonstrates how thoughtful analytics design can scale with your product while maintaining clarity and purpose. Remember: the best analytics implementation isn’t the one that tracks everything, but the one that captures what matters most for your users’ success.
This was part 1 in our series “One tracking plan a day” Season 1 - startup tools. Make sure you visit all other parts of the series:
- Slack - 28.01.25
- Superhuman - 29.01.25
- VimCal - 30.01.25
- Asana - 31.01.25
- Canva - 03.02.25
- Loom - 04.02.25
- Miro - 05.02.25
- Grammarly - 06.02.25
- Replit - 07.02.25
- Hubspot - 10.02.25
- Stripe - 11.02.25
- Zoom - 12.02.25
- Ghost - 13.02.25
- Amplitude - 17.02.25
- GSheets - 18.02.25
- Lightdash - 19.02.25
- Claude - 20.02.25
- Reconfigured - 21.02.25
If you like to generate your own tracking plans by using my book with Claude AI, get your copy here:
Join the newsletter
Get bi-weekly insights on analytics, event data, and metric frameworks.