Product Strategy meets Analytics — Asana Tracking Plan
Analytics can feel deceptively simple when you start with a product like Asana. Track some tasks, measure completion rates, count active users - done, right? But as your product evolves beyond its core features, your analytics need to evolve too. The real challenge isn’t tracking basic metrics; it’s building an analytics framework that captures both your product’s essential heartbeat and its strategic evolution. While simple task management metrics might tell you if users are active, they won’t reveal if your product is truly delivering on its strategic promise.
In this post, we’ll explore how to build an analytics framework that grows with your product, using Asana as our example. We’ll look at how to move from basic task tracking to measuring strategic initiatives, how to turn these insights into product features, and how to track success across both individual users and entire organizations. Whether you’re building a task management tool or any other SaaS product, these principles will help you create analytics that drive product growth.
In this content series - season 1, I create a tracking plan for a typical start-up tool every day for four weeks (I take a break on the weekend), so 20 in total. This is the 5th one: Asana. Here is the season overview:
![]()
From Basic to Strategic: How to Evolve Your Analytics as Your Product Grows
Start with Your Core: Identifying Essential Product Activities
Every product has a heartbeat - that core activity that drives everything else. For Slack, it’s messages. For Superhuman, it’s emails. For Asana, it’s tasks. When building your analytics foundation, start by identifying this pulse.
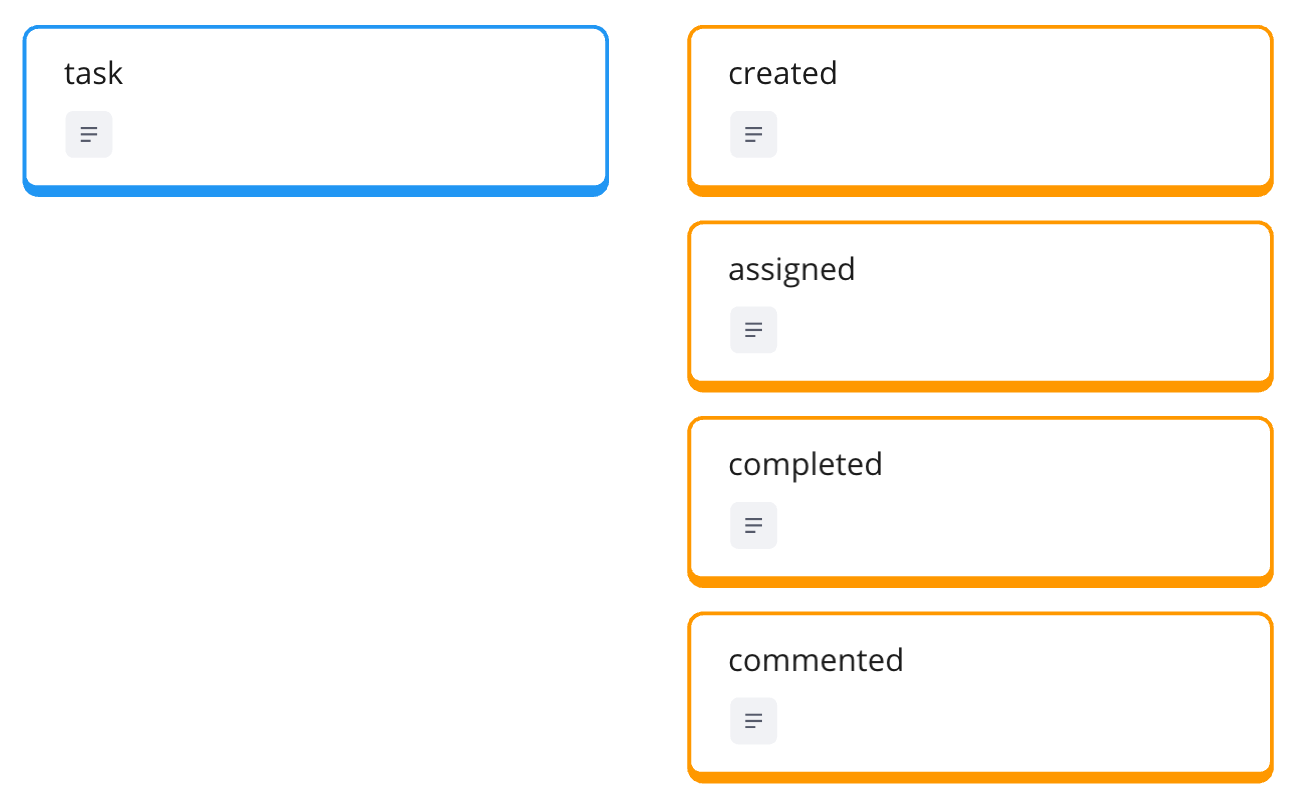
In its simplest form, a task management tool like Asana needs just two fundamental entities:
- Tasks: The core unit of work
- Users: The people doing the work
That’s it. You could build a working task management analytics setup with just these two entities and a handful of key activities:
- Task created
- Task completed
- Task assigned
- Task commented
“If you really want to get started, create a tracking plan for a task management for just a to-do app. The to-do app already has a very simple data model by itself. And therefore the analytics model is also pretty simple.”
But even with this minimal setup, you’re capturing the essential rhythm of your product. You can see if tasks are being created (adoption), completed (success), assigned (collaboration), and discussed (engagement).
The power of starting with core activities goes beyond simplicity. It gives you a stable foundation for future expansion. As your product evolves, you might add projects to group tasks or teams to organize users. But these additions build upon your core tracking rather than replacing it.
Think of activities, not interactions. While it might be tempting to track every click and view, focus instead on meaningful activities that represent user progress or value achieved. A task being completed tells you more about product success than how many times someone viewed the task details.
By keeping your initial tracking focused on these essential product activities, you create clarity. Your analytics will tell a clear story about how people use your product’s core functionality - a story that becomes your baseline for measuring all future additions.
Identify New Strategic Features: Aligning Analytics with Product Direction
Once you’ve established your core tracking, it’s time to look ahead. Your product isn’t standing still - it’s evolving to stay competitive and deliver more value. For Asana, this means expanding beyond basic task management into areas like goals and automated workflows.
Where do you find these strategic signals? Start with your product’s current direction:
- Marketing messages (what sets you apart?)
- Recent major feature launches
- Areas of significant investment
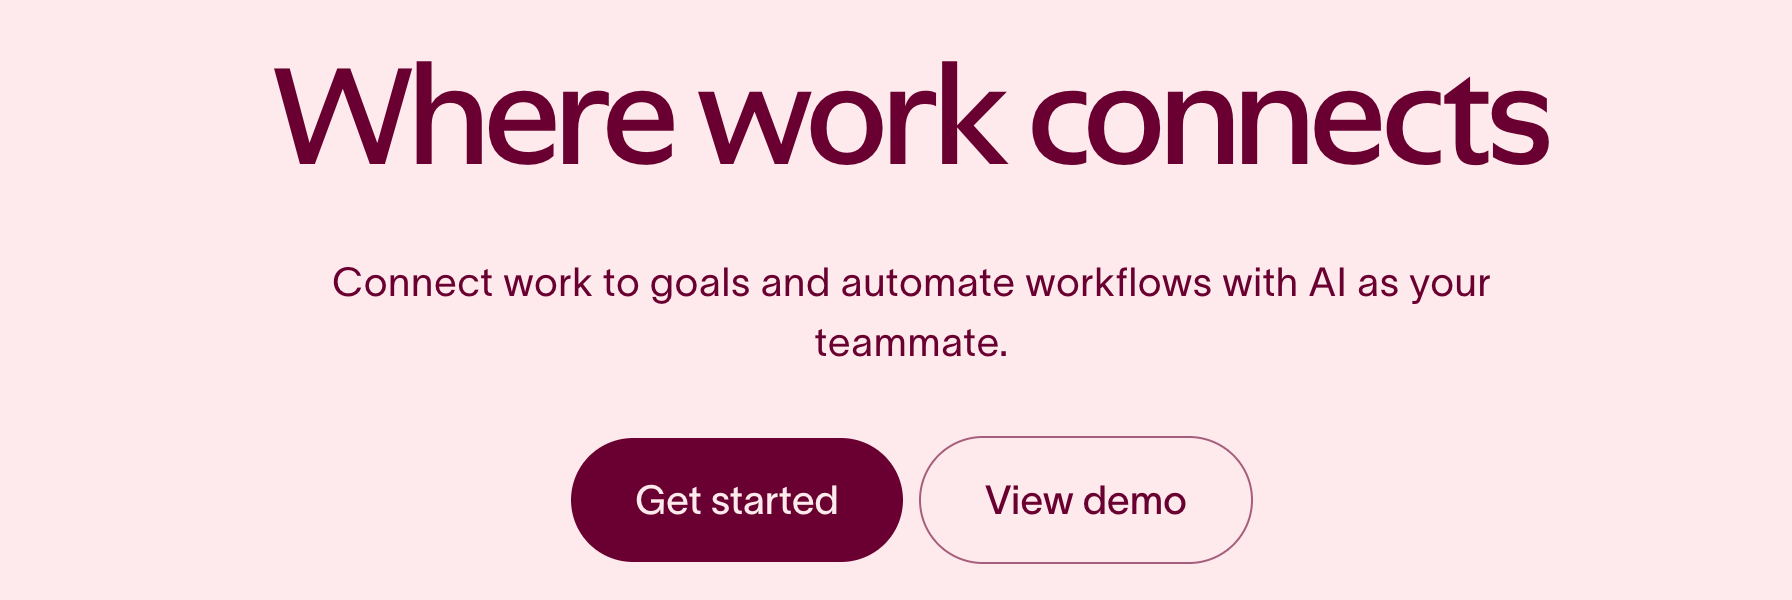
Looking at Asana’s homepage, we see: “Connect work to goals and automate workflows with AI as your teammate.” This isn’t just marketing speak - it’s a signal about where the product is headed. Basic task management isn’t enough anymore; they’re betting on enterprise orgs, goals and automation as key differentiators.
But not every new feature deserves its own tracking setup. Ask yourself:
- Is this feature central to our product strategy?
- Will it fundamentally change how users get value?
- Do we need detailed insights about its adoption?
For Asana, goals and workflows aren’t just nice-to-have features - they represent a strategic shift toward enterprise functionality. They deserve their own entities in our tracking plan, with dedicated activities like:
- Goal created
- Goal linked to project
- Workflow created
- Workflow step completed
“When we measure how many projects have workflows, it can enable us to create an index or percentage of ‘You have 20% projects with automation.’ This can be reported to organization admins to show how many teams have adopted automation, and the potential for time savings or quality improvements.”
The key is balance. You want to capture strategic initiatives without overwhelming your analytics setup. Focus on activities that indicate strategic success - not just feature usage, but value achieved through these new capabilities.
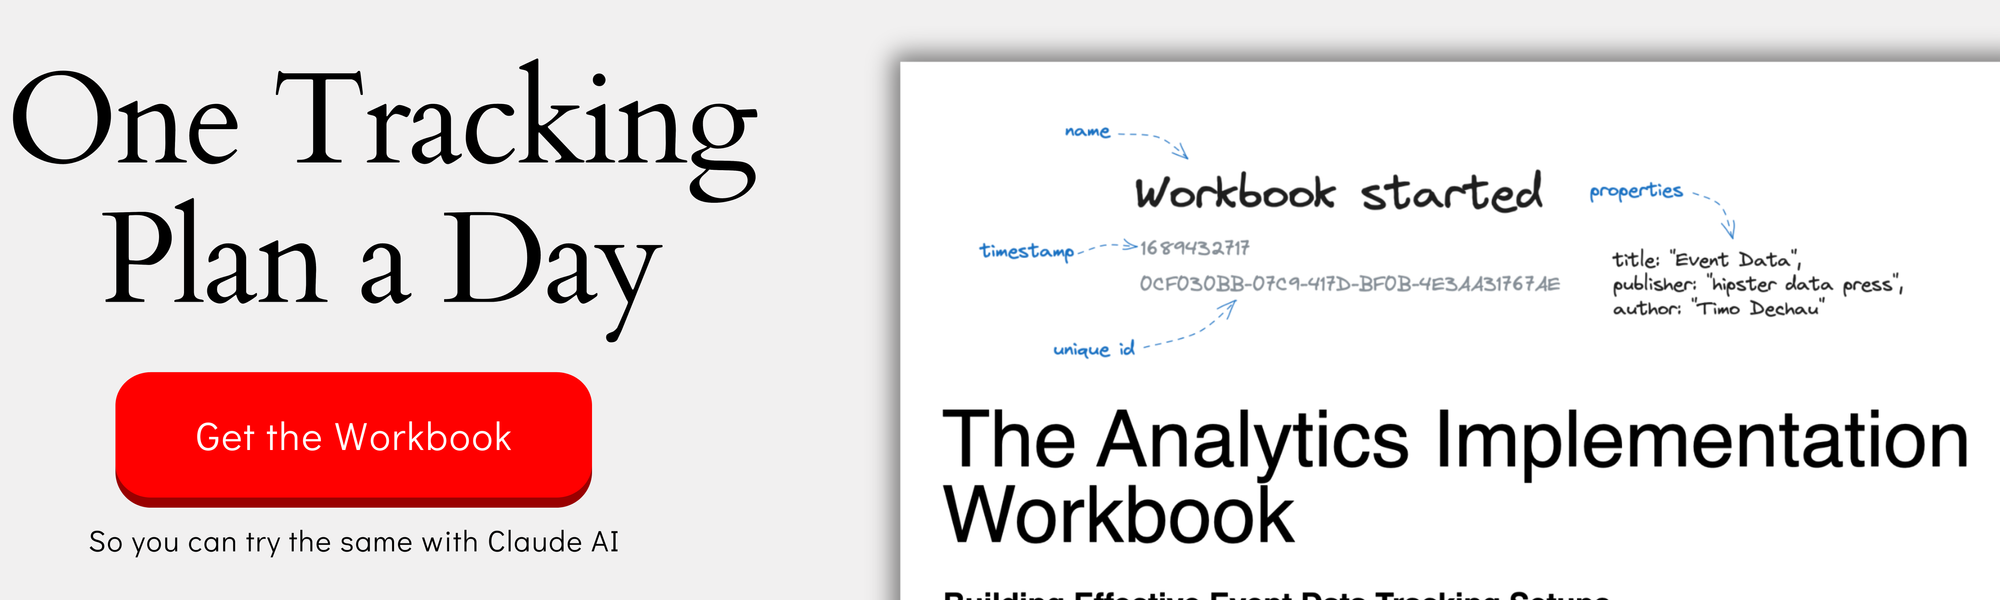
This work is based on the chapters about event data design in my book Analytics Implementation Workbook. There, you can read more details about the D3L framework.
Bridge the Gap: Connecting Core Features with Strategic Initiatives
The real magic happens when you connect your core tracking with strategic features. It’s not enough to track tasks separately from goals, or workflows in isolation. You need to understand how these elements work together to drive user success.
Consider three key connection points:
- Properties that link core and strategic features
- Activities that span multiple features
- Success metrics that combine both levels
For Asana, this means tracking properties like:
- Was this task created by a workflow?
- Is this project connected to a goal?
- How many automated tasks exist in this project?
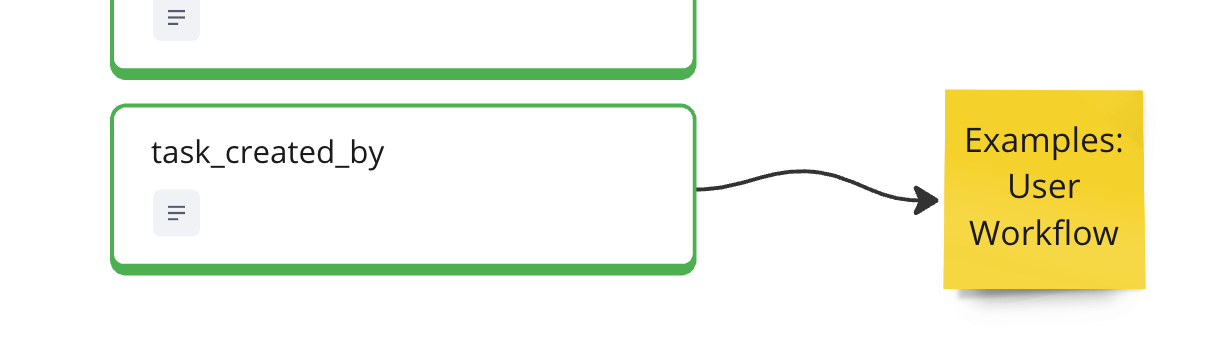
These connections enable powerful insights. Instead of just seeing “1000 tasks created this month,” you can understand that “30% of tasks are now created automatically through workflows.” This isn’t just a vanity metric - it indicates real efficiency gains and strategic feature adoption.
Think about progressive disclosure in your analytics. A user’s journey might start with basic task management, but you want to identify moments when they’re ready for more:
- When they’re managing multiple recurring tasks (workflow opportunity)
- When projects start connecting to broader initiatives (goals opportunity)
- When manual work becomes repetitive (automation opportunity)
The goal isn’t just to measure feature adoption - it’s to understand how strategic features enhance your core product value. Are teams with automated workflows completing more tasks? Are projects linked to goals showing better completion rates?
Remember: Your core features are still the foundation. Strategic features should enhance, not replace, this foundation. By connecting both levels in your analytics, you create a complete picture of how users progress from basic functionality to advanced capabilities - and the value they gain along the way.
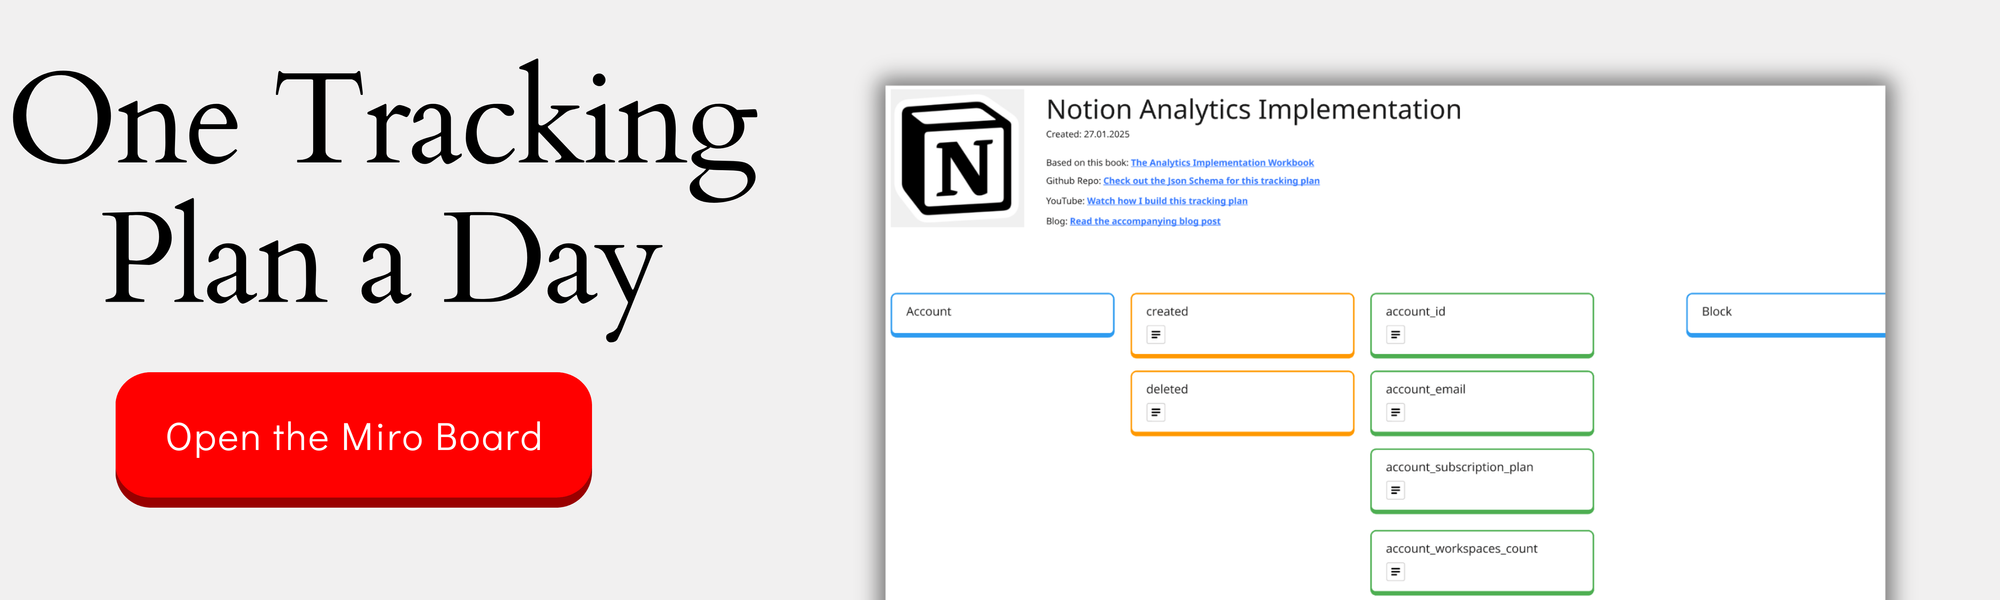
You can check out the complete design on the Miro Board:
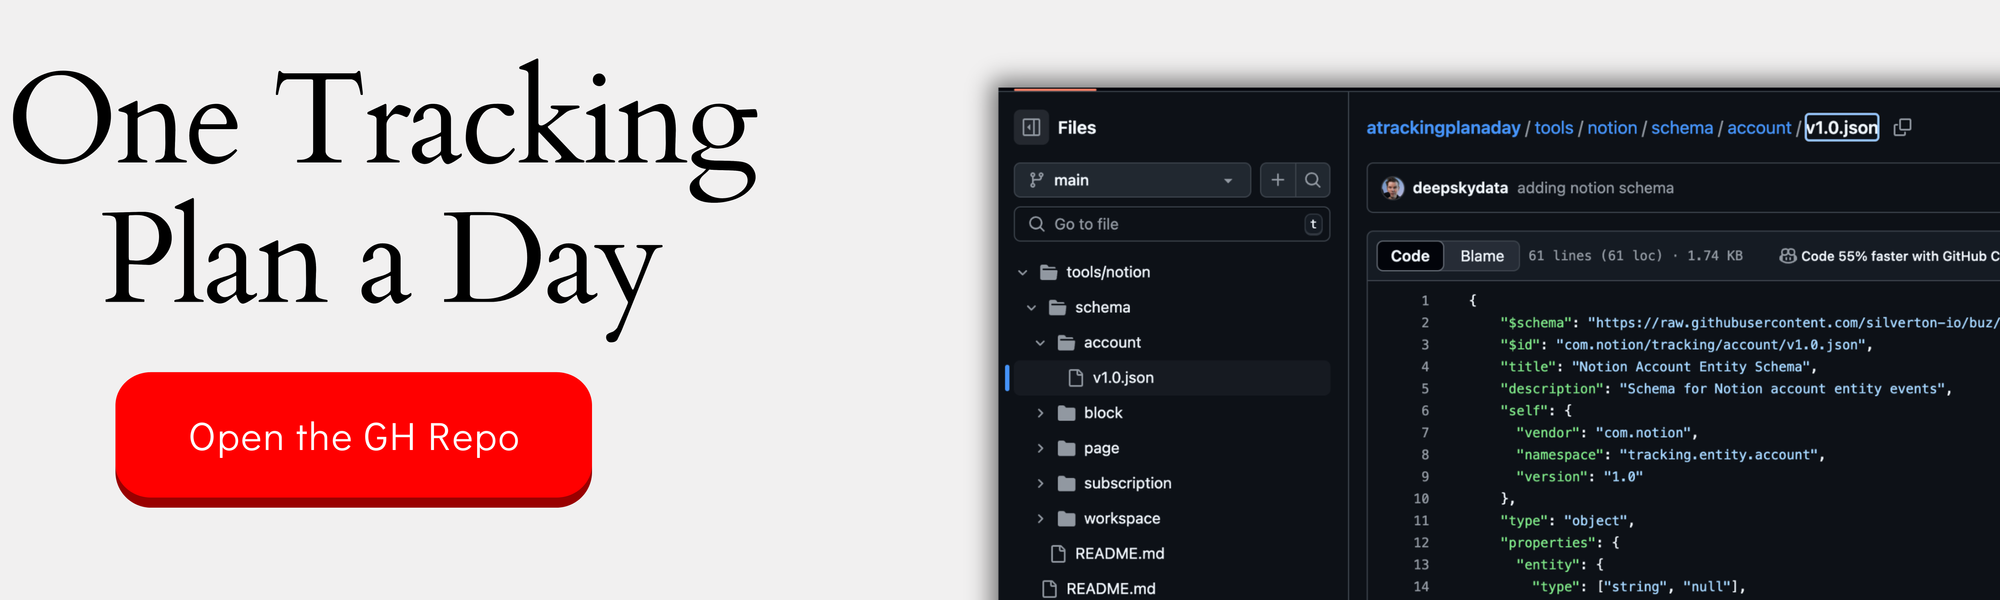
If you want the nerdy version, you can check out the JSON schemas here:
Turn Analytics into Action: Creating Product Features from Data Insights
Find the Signal: Identifying Opportunities in Usage Data
Behavioral data tells stories - if you know how to listen. The key is identifying patterns that point to opportunities for product improvement, not just tracking metrics for their own sake.
Let’s look at Asana’s task data. Beyond basic counts of tasks created or completed, look for patterns that suggest deeper needs:
- Copy task creation with similar structures
- Common sequences of task assignments
- Projects that follow consistent templates
- Tasks that always have the same descriptions
These patterns are gold mines for product opportunities. When you see users manually recreating the same task structures over and over, that’s not just usage data - it’s a signal that automation could add value.
The real insights often come from combining different data points. Don’t just look at what users do, but the context around their actions:
- Time spent on repetitive actions
- Common sequences of activities
- Variations in task quality
- Patterns across different teams
For example, if you notice that teams with structured task templates consistently complete projects faster and with fewer revisions, that’s a signal. It suggests that helping other teams implement similar structures could improve their efficiency.
Look for friction points where users are working around limitations:
- Manual copy-pasting of task descriptions
- Recurring task creation
- Repetitive task assignments
- Similar project setups across teams
Each of these friction points is an opportunity. The goal isn’t just to collect data about these patterns - it’s to identify where you can remove barriers and streamline workflows. The best product improvements often come from watching what users are already trying to accomplish, then making it easier for them to do it.
Design Data-Driven Features: From Insight to Implementation
Once you’ve identified patterns in your data, the next step is turning those insights into concrete features. This isn’t just about building what users ask for - it’s about solving problems they might not even realize they have.
Take Asana’s workflow automation opportunity. The data might show:
- Teams manually creating similar tasks repeatedly (by duplicating them)
- Inconsistent task descriptions across projects
- Time spent on routine task management
- Varying quality in task documentation
From these insights, you can design features that not only save time but improve quality. For instance, an automation system that:
- Creates standardized tasks automatically
- Maintains consistent documentation
- Ensures proper task assignment
- Preserves best practices
“Creating tasks automatically is a huge win on saving time, but what is often missed is improving qualities and standards. Because you define one time and one central place how this task should look like… When you run this workflow one time, you figure out, ‘ah, we should have a link to this kind of documentation.’ You just update the task template and the next time the task has been created, it has the better version already.”
But don’t stop at just building the feature. Design it to provide insights back to users:
- Show time saved through automation
- Track quality improvements
- Measure consistency gains
- Highlight adoption opportunities
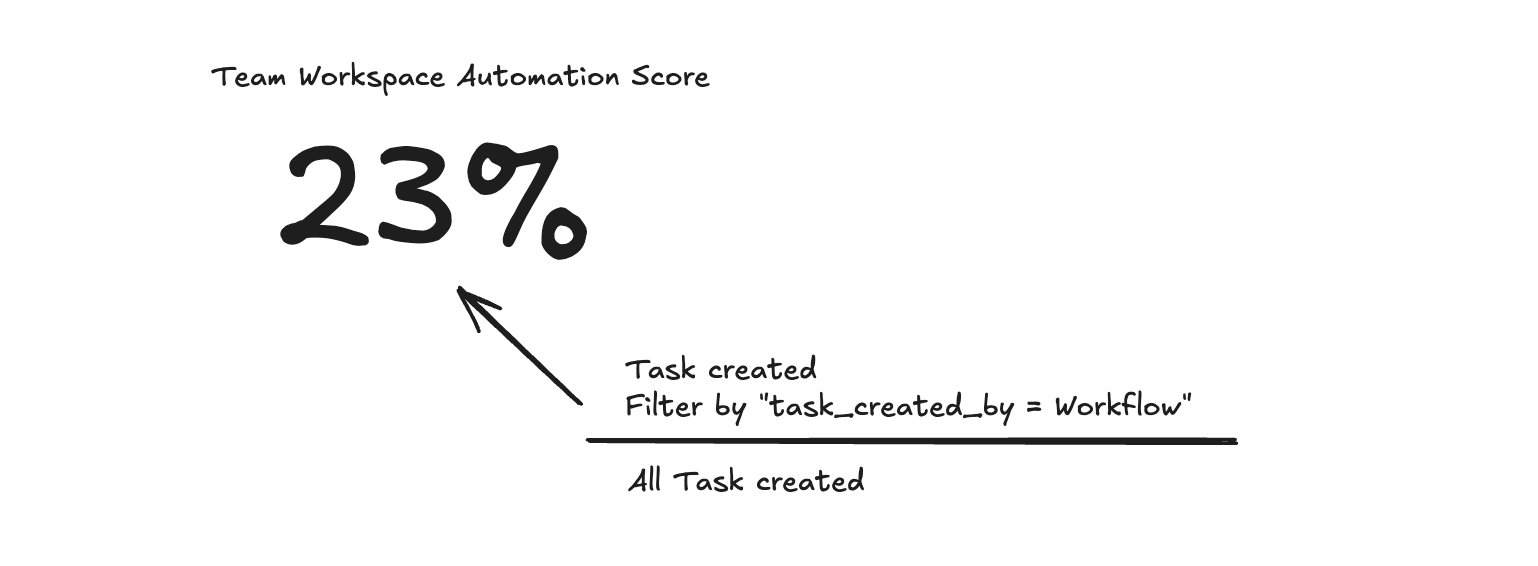
This is where concepts like an “automation score” become powerful. It’s not just a metric - it’s a feature that helps users understand their progress and identifies opportunities for further improvement. Each team can see their automation rate and get suggestions for additional workflows they could implement.
Remember: The best data-driven features don’t just solve problems - they help users understand the value they’re getting and guide them toward even better practices.
Close the Loop: Using Features to Drive Better Data
When you build features informed by data, you create opportunities to collect even better data. It’s a virtuous cycle that drives product improvement and user success.
Think about Asana’s workflow automation. When teams start using automated workflows, you can collect richer data about:
- Which tasks are automated vs. manual
- Time saved through automation
- Quality improvements in task documentation
- Patterns of workflow adoption across teams
This enhanced data collection becomes possible because the feature itself creates more structured, measurable interactions. Instead of trying to interpret messy manual processes, you get clear signals about how work gets done.
The key is using this data to drive further engagement:
- Show teams their automation progress
- Highlight successful workflow patterns
- Identify opportunities for more automation
- Surface best practices from power users
Each insight can trigger new actions. For example:
- A team sees their 20% automation rate
- They discover other similar teams are at 40%
- They explore those teams’ workflow patterns
- They implement new automated processes
- Their automation rate improves
- The data gets even richer
This creates a self-reinforcing cycle. Better data leads to better features, which lead to better usage patterns, which generate even better data. Each loop helps users become more successful while giving you deeper insights into how your product delivers value.
The goal isn’t just to collect data or build features - it’s to create a continuous improvement cycle where data and features work together to drive user success. When done right, users don’t even think about the data they’re generating; they just experience a product that keeps getting better at helping them work efficiently.
Tracking Success at Scale: Measuring Progress Across Users and Organizations
Define Progress States: Creating Clear Success Milestones
Success in a product like Asana isn’t binary - it’s a progression through different states of maturity and value. Think of it like levels in a game, where users and organizations develop new capabilities over time.
Start by mapping out clear progress milestones. For Asana, these might include:
- Beginner: Created first tasks and projects
- Activated: Regular task management and collaboration
- Workflow Adopter: Using automated processes
- Goal-Driven: Connecting tasks to strategic goals
- Power User: Combining all features effectively
Each state should have clear, measurable criteria. For instance, a “Workflow Adopter” might be defined by:
- Created at least one workflow
- Automated task creation in multiple projects
- Regular use of workflow features
- Positive automation impact metrics
Don’t just track where users are - track how they move between states. This progression tells you:
- Common paths to success
- Typical timeframes for advancement
- Potential stuck points
- Opportunities for intervention
“Moving from new users into activated users often presents the most significant improvement potential. It’s typically where you’ll encounter your most significant losses. I advocate for a specific state to truly understand what constitutes an activated user.”
Keep your state definitions simple at first. You can always add complexity later, but starting with clear, understandable milestones makes it easier to:
- Communicate progress to stakeholders
- Guide user advancement
- Identify improvement opportunities
- Measure success over time
Remember: States should reflect real value milestones, not just feature usage. They should tell you not just what users are doing, but how successfully they’re achieving their goals with your product.
Track Organization Maturity: Beyond Individual Usage
Organization-level success isn’t just the sum of individual user activities. It’s about how deeply your product’s strategic features are woven into the organization’s workflows and processes.
For Asana, organization maturity reveals itself through patterns like:
- Percentage of teams using workflows
- Goal adoption across projects
- Automation rates in different departments
- Cross-team collaboration metrics
Think beyond simple usage metrics. Look for signals that show strategic feature adoption:
- Are workflows being shared across teams?
- Do goals connect multiple departments?
- Is automation knowledge spreading organically?
- Are best practices being replicated?
“When we look on the customer level, we actually look on the organization because they are in the end who’s paying the money. So they are in the end who’s deciding should we keep the subscription? How many users should we actually add to the tool?”
Create clear indicators of organization-level maturity:
- Workflow Value Achieved: Organization has implemented successful automation
- Goal Framework Established: Teams are aligning work with objectives
- Cross-Team Collaboration: Projects and goals connect different teams
- Best Practice Adoption: Successful patterns spread across teams
These indicators help you understand not just if an organization is using your product, but how successfully they’re implementing its strategic features. This understanding is crucial for:
- Predicting renewal likelihood
- Identifying expansion opportunities
- Guiding customer success efforts
- Targeting growth initiatives
Remember: Organization maturity isn’t just about depth of usage - it’s about breadth of adoption and strategic alignment. An organization might have power users but still be immature if strategic features aren’t widely adopted across teams.
Connect Individual and Organization Success: Finding Growth Patterns
The most powerful insights often emerge when you connect individual user success with organization-level adoption. This multi-level view reveals patterns that neither perspective alone can show.
Key questions to explore at this intersection:
- Are successful users clustered in specific teams?
- How does individual workflow adoption spread?
- Which teams lead strategic feature adoption?
- Where do power users emerge?
“The same thing that we apply on the organization or customer level, we could also apply on the user. So we could, for example, say, does this user have unlocked workflows yet? And then this is an interesting case to analyze later: how has an organization adopted workflows? This is one view. The second view is how many users actually have adopted it?”
Look for growth patterns that connect both levels:
- Power users emerging in specific departments
- Workflow adoption spreading team by team
- Goal alignment cascading through organizations
- Automation practices being shared
These patterns help identify:
- Natural expansion paths
- Internal champions
- Adoption barriers
- Growth opportunities
The real value comes from using these insights to drive growth. For example:
- When you spot a team successfully using workflows, guide them to share their practices
- When you find power users, help them become internal advocates
- When you see departments lagging, provide targeted support
- When you identify successful patterns, create playbooks for other teams
Remember: Individual and organizational success reinforce each other. Power users drive organization adoption, while organization-wide practices create more successful users. Understanding this relationship helps you create strategies that work at both levels simultaneously.
Creating an analytics framework isn’t a one-time task - it’s an evolution that mirrors your product’s growth. We started with Asana’s core task management features, expanded to include strategic initiatives like goals and workflows, and showed how analytics can drive product development while measuring success across different scales.
But the most powerful insight might be the simplest: good analytics grow with your product. They help you identify opportunities, validate strategic directions, and measure success in ways that matter to both individual users and entire organizations. Whether you’re building your first tracking plan or evolving an existing one, remember to balance the essential with the strategic, turn insights into action, and measure success across all levels of scale.
This was part 5 in our series “One tracking plan a day” Season 1 - startup tools. Make sure you visit all other parts of the series:
- Notion - 27.01.25
- Slack - 28.01.25
- Superhuman - 29.01.25
- Vimcal - 30.01.25
If you like to generate your own tracking plans by using my book with Claude AI, get your copy here:
This work is based on the chapters about event data design in my book Analytics Implementation Workbook. There, you can read more details about the D3L framework.
Join the newsletter
Get bi-weekly insights on analytics, event data, and metric frameworks.