Short-as-possible tracking plan — Vimcal
You’ve probably been there: staring at your analytics dashboard, drowning in a sea of click events, page views, and user actions, yet somehow still unable to answer the simple question “are people actually using our product?” It’s a common trap in product analytics - tracking everything but understanding nothing. This was exactly where I found myself years ago, watching teams build elaborate tracking plans that collected every possible interaction but failed to tell the product’s story.
Today, I’ll show you a different approach to analytics design - one that puts humans first, focuses on meaningful insights, and evolves naturally with your product. Using Vimcal, a calendar app for people with too many meetings, as our example, we’ll explore how to build analytics that tell your product’s story instead of just logging its clicks.
In this content series - season 1, I create a tracking plan for a typical start-up tool every day for four weeks (I take a break on the weekend), so 20 in total. This is the second one: Vimcal. Here is the season overview:
![]()
From Clicks to Customer Journey: Why Traditional Event Tracking Falls Short
The Problem with Click-Based Analytics
When teams first dive into product analytics, they often start in the most obvious place: tracking clicks. It’s a natural instinct - open up the application, identify where users can click or interact, and start collecting that data. After all, isn’t that what users do? They click through our carefully designed interfaces.
But here’s the trap: clicking isn’t the same as using.
Let’s look at Vimcal, a calendar app, as an example. When a user creates a new calendar event, they might:
- Click the ”+” button in the interface
- Use a keyboard shortcut (Vimcal is big on keyboard shortcuts)
- Accept an invitation from someone else
- Have an event created automatically through a booking link
Four different interaction paths, one actual product usage: creating an event. If we only tracked clicks, we’d miss most of the story.
“Clicking is part of using to some degree, but using a product is two or three abstraction layers up. We want to look at using a product from a high level,” is how I explain it to teams when discussing analytics implementation.
The problems with click-based analytics compound quickly:
- Data becomes noisy and hard to analyze
- Different paths to the same outcome create fragmented data
- Teams struggle to understand actual product usage
- Reports become focused on UI optimization instead of product value
This becomes particularly painful when trying to answer fundamental questions about product adoption. When a product manager asks “How many users are successfully using our calendar features?” they don’t want to piece together a puzzle of click events - they want to understand product usage at a higher level.
The challenge, then, isn’t to track more clicks - it’s to track meaningful product usage. This requires a different approach to analytics design, one that starts with understanding what “using the product” actually means.
This work is based on the chapters about event data design in my book Analytics Implementation Workbook. There, you can read more details about the D3L framework.
The Power of Layered Thinking
Moving beyond clicks requires a structured way to think about analytics. This is where the three-layer framework comes in - a way to separate different types of events based on their level of abstraction and business value.
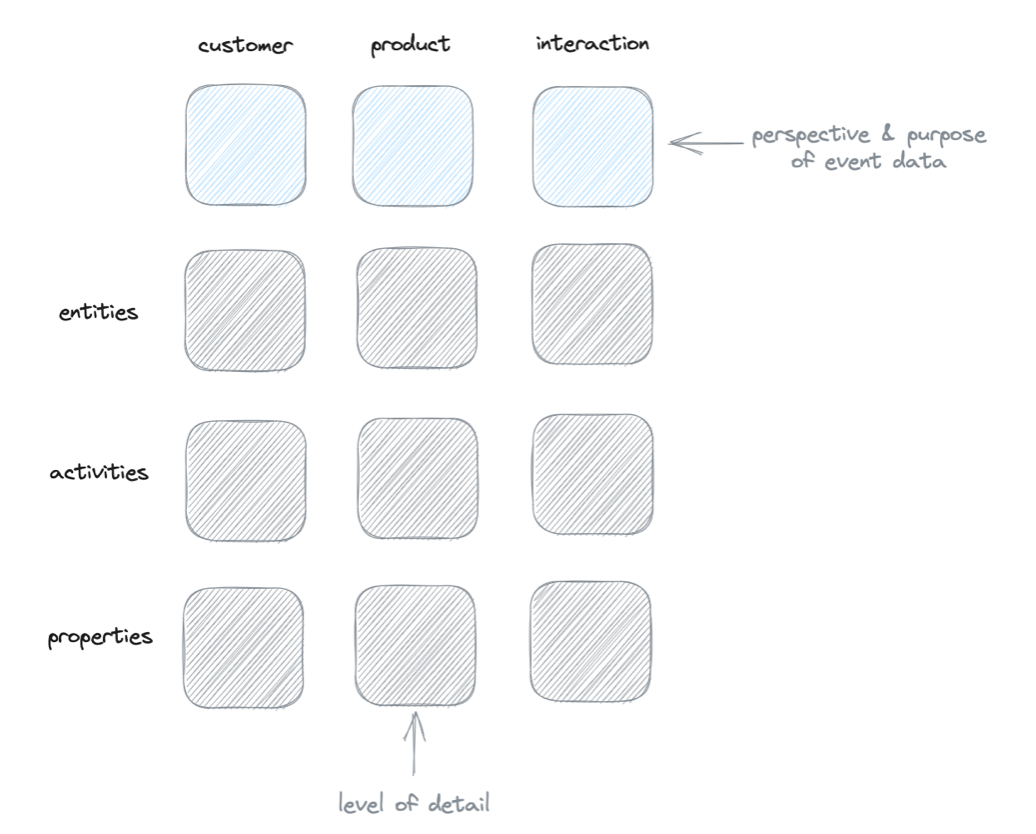
Let’s break down these layers using our calendar app example:
Interaction Layer
- Captures raw interactions (clicks, keyboard shortcuts, etc.)
- Lives at the bottom of the stack
- Perfect for UI/UX analysis but kept separate from product analytics
- Example: tracking when someone uses “cmd+e” to create an event
Product Layer
- Records actual product usage
- Focuses on core features and jobs to be done
- Combines multiple interaction paths into meaningful events
- Example: “event_created” regardless of how it happened
Customer Layer
- Connects product usage to customer success
- Maps user journeys from first value to power usage
- Helps identify patterns that lead to long-term adoption
- Example: detecting when someone becomes an “active user” based on their event creation patterns
“We track specific activities from the product layer, and when they combine, we can say, ‘Okay, this user was active (based on these four different product events) in the last seven days.’ This is how the layers work together to tell the full story.”
The magic happens in how these layers interact. A single customer-layer event like “user_activated” might combine multiple product-layer events: creating their first calendar event, sending their first invitation, and setting up their first booking link. Each of those product events might happen through various interactions.
This layered approach solves multiple problems:
- Keeps interaction data available but separate
- Makes product usage patterns clear and analyzable
- Enables meaningful customer journey tracking
- Creates a clear hierarchy for organizing analytics
The result? Analytics that tell the story of product usage rather than just recording clicks.
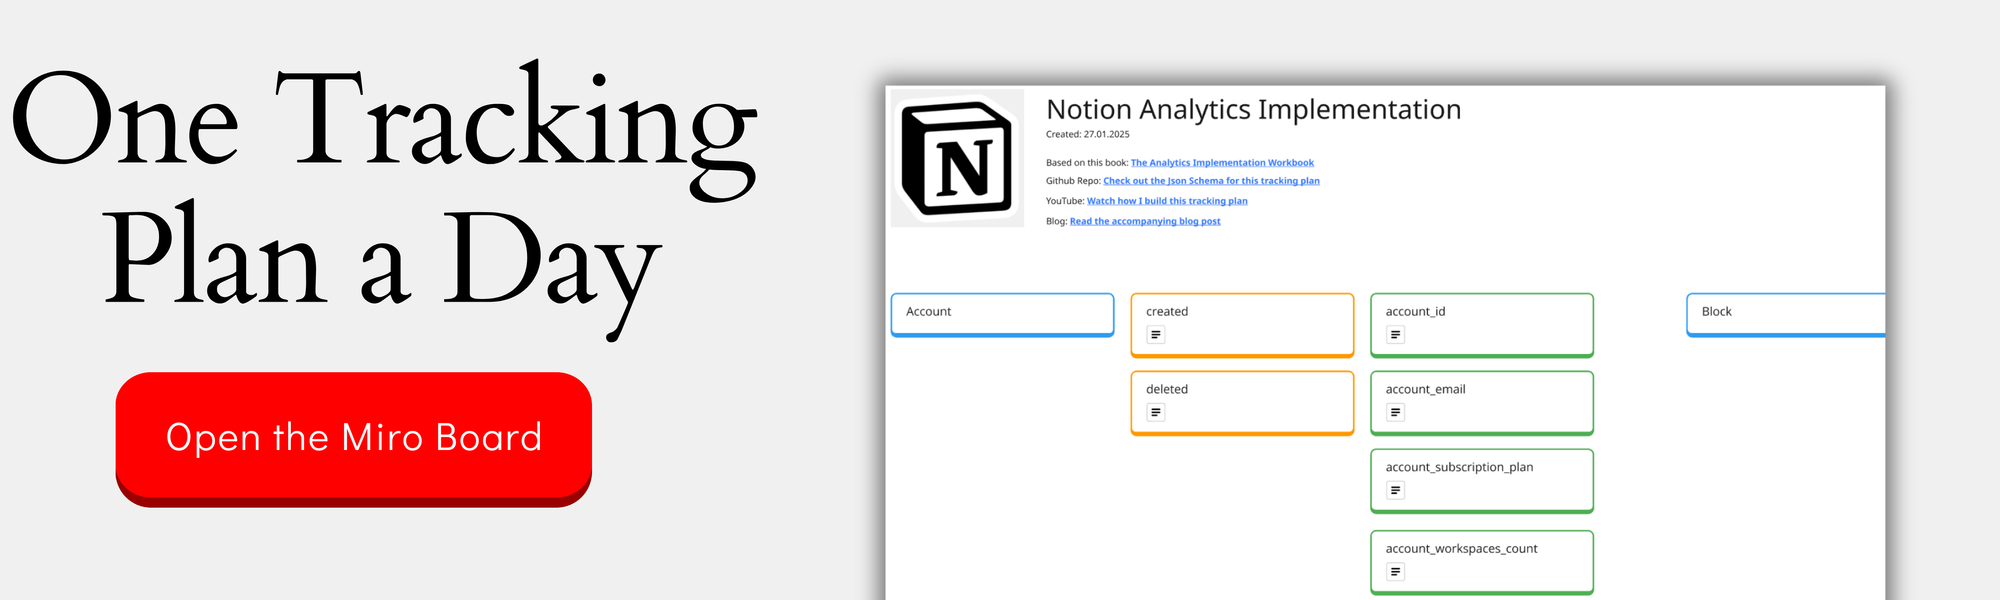
You can check out the complete design on the Miro Board:
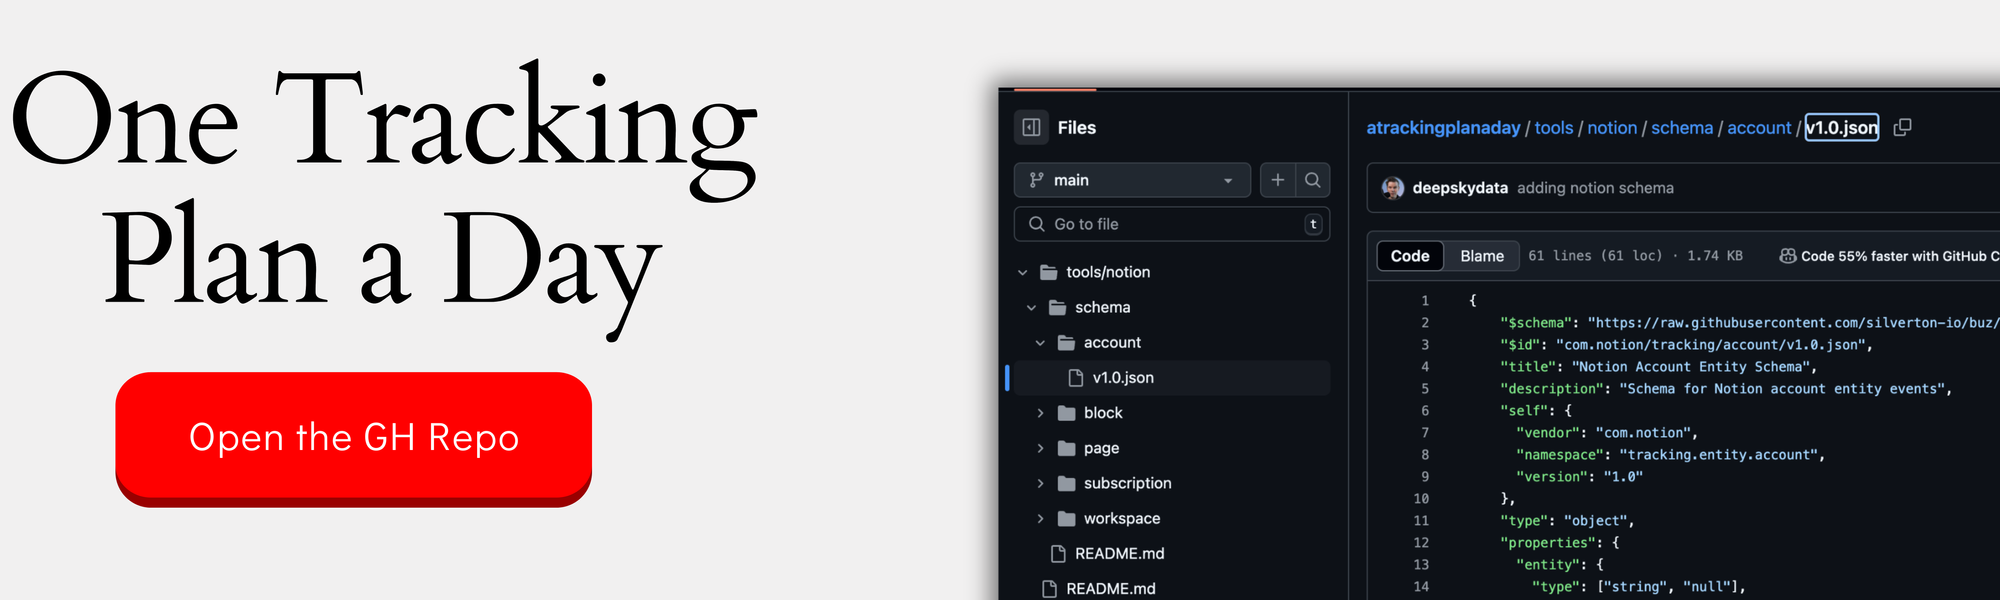
If you want the nerdy version, you can check out the JSON schemas here:
Building a Foundation for Insights
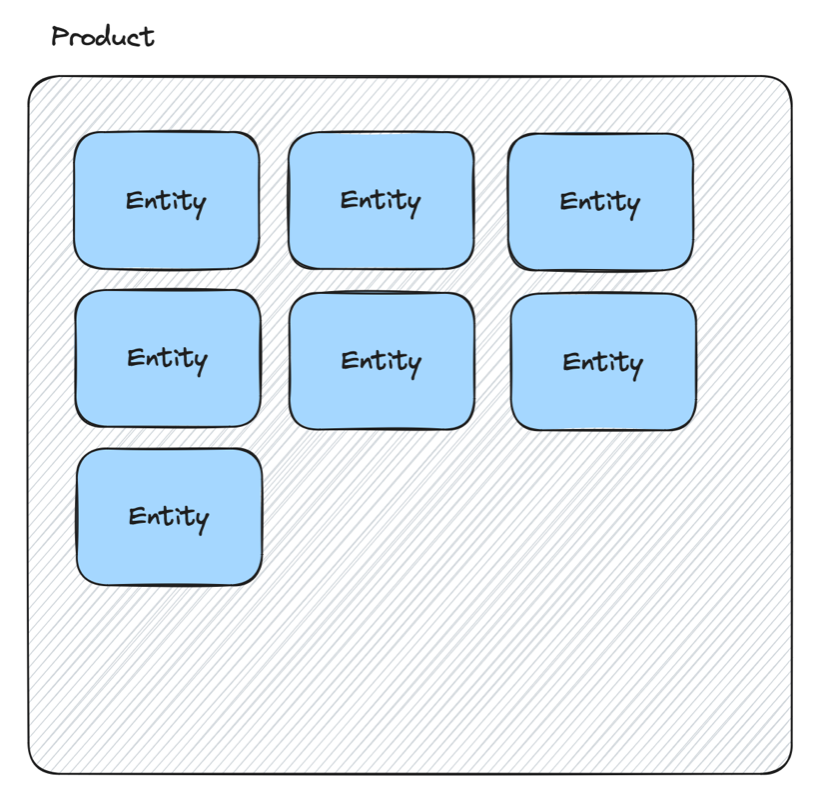
To make analytics truly valuable, we need to organize our events in a way that makes sense not just for data collection, but for the people who’ll actually use this data. This is where the entity-activity model comes in.
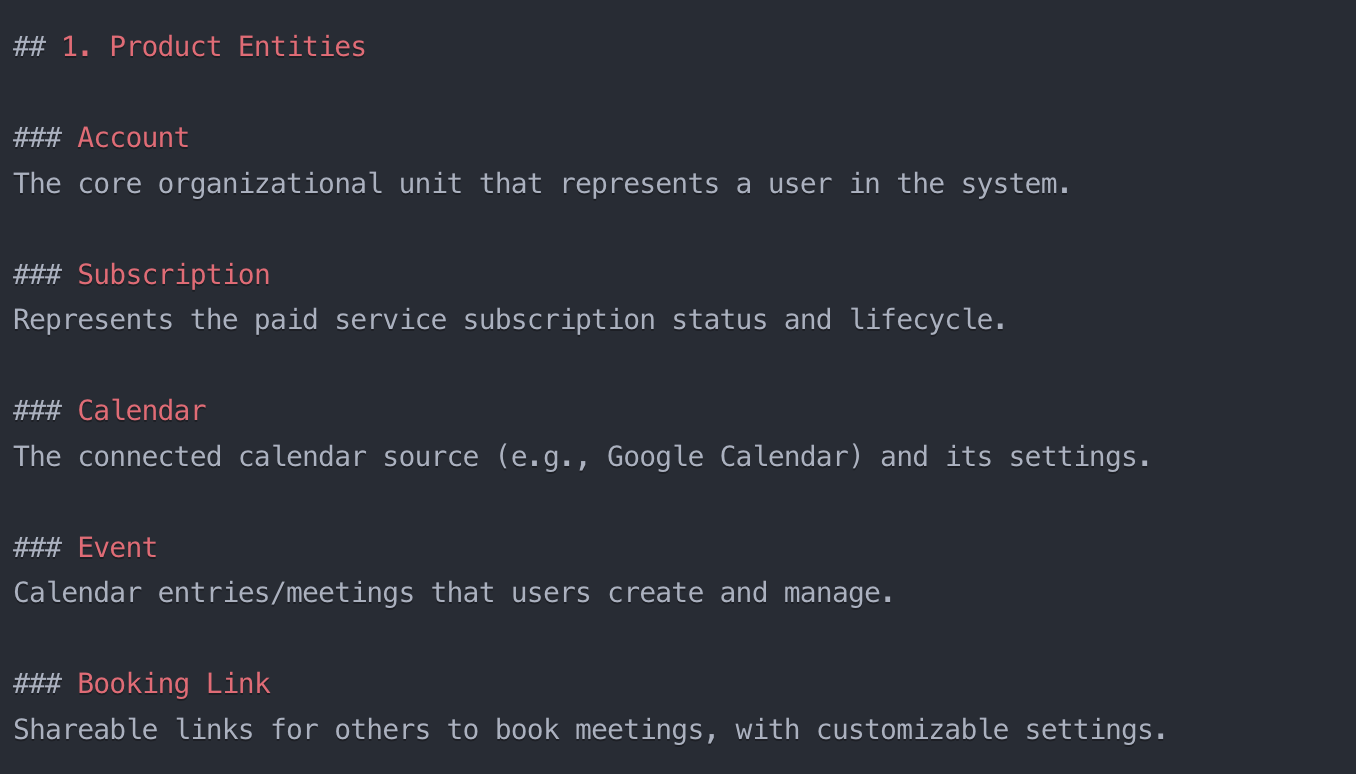
For Vimcal, our core entities are the building blocks of the product:
- Calendar (the container for everything)
- Event (the actual meetings/appointments)
- Account (the user’s home base)
- Booking Link (the viral growth feature)
“An entity for me should be a core building block of a product. My first test is usually: when I remove this entity, is the product still usable?” This simple test helps prevent overcomplicating your analytics structure.
Each entity has activities - created, deleted, shared, etc. But here’s where many teams go wrong: they track too much. Not every update or change needs to be an event. When a product manager checks the analytics tool twice a month, scrolling through 70 different events isn’t a good experience.
Instead, focus on activities that indicate meaningful product usage:
- First value moments (creating and sending first calendar invite)
- Adoption signals (creating five events in seven days)
- Power user behavior (regular booking link usage)
- Risk indicators (no activity in last 30 days)
The goal isn’t to track everything - it’s to track the right things. Properties can fill in the details without cluttering your main event structure. For instance, instead of creating separate events for Zoom vs Google Meet calendar events, use a “video_provider” property.
This foundation makes it possible to answer real questions about your product: Are users getting value? How quickly do they adopt key features? When do they become power users? Most importantly, it makes these answers accessible to everyone in your organization, not just the analytics team.
Designing Analytics for Humans: The Art of Less is More
The Once-a-Month User Problem
Here’s a reality check: most people in your company aren’t analytics experts. While your data team lives and breathes these tools daily, product managers, marketers, and other stakeholders might check your analytics setup once or twice a month.
Think about that for a moment. These occasional users:
- Don’t remember where things are located
- Have forgotten what events mean
- Need to relearn the interface each time
- Are often trying to answer urgent questions quickly
“When I build an analytics setup for a data team, it’s often the team that creates the setup for themselves, and it works pretty okay because they define it how they understand things. But everyone else checks an analytics tool maybe twice a month. Their core job is something totally different. They live in totally different tools.”
This creates a fundamental challenge. The people who build analytics systems (data teams) have fundamentally different needs from the people who use them occasionally (everyone else). It’s like building a professional video editing suite when most people just want to trim a clip.
Consider a product manager trying to understand adoption of a new feature. They don’t want to:
- Scroll through 70 different events
- Remember complex naming conventions
- Piece together multiple data points
- Decode technical properties
They want clear, accessible insights. If they can’t find what they need in 5-10 minutes, they’ll either give up or, worse, make decisions without data.
This is why designing for the once-a-month user is crucial. Every additional event, every complex naming scheme, every nested property adds cognitive load for these occasional users. The solution isn’t to dumb things down - it’s to make them intelligently accessible.
Creating a Clean Analytics Experience
Building a clean analytics experience starts with a counterintuitive approach: saying no to tracking more things. Instead of tracking everything possible, we need to focus on what matters and how to organize it in a way that makes immediate sense to anyone opening the analytics tool.
Let’s look at how this played out in Vimcal’s case. Initially, we considered tracking integrations (Zoom, Google Meet) as their own entity. But we asked ourselves: does this deserve top-level visibility in our analytics? The answer led us to move it to properties instead.
Three key principles for keeping analytics clean:
Start with Clear Entities
- Use names that match how people think about your product
- Keep the number of entities small (4-6 is often enough)
- Make them memorable and immediately understandable
- Example: Calendar, Event, Account, Booking Link
 Entities are the foundations for the product layer events and help to introduce a clear structure
Make Events Tell a Story
- Name events from a user’s perspective
- Avoid technical terms like “updated” or “modified”
- Focus on meaningful actions that indicate product usage
- Keep your total event count manageable
Use Properties for Details
- Hide complexity in properties rather than creating new events
- Add context without cluttering the main interface
- Make properties discoverable when needed
- Example: Adding “video_provider” instead of separate Zoom/Meet events
“A good data user experience would make it pretty easy for them to immediately find the things they’re looking for during those two times they visit per month.”
Think of it like organizing a kitchen. The most-used items should be easily accessible, while specialty tools can live in drawers. Everything has its place, but not everything needs to be on the counter.
Balancing Depth and Accessibility
The secret to great analytics design isn’t choosing between deep insights and accessibility - it’s knowing where to put each piece. Think of it like an iceberg: the most important data points visible above water, with deeper complexity available when needed.
This is where our layered approach really shines:
Surface Level (Highly Accessible)
- Core product metrics everyone needs
- Well-named entities and events
- Clear customer journey states
- Example: “Active Users” instead of “Users who performed 5+ actions in 7 days”
Middle Layer (Moderate Complexity)
- Properties that add context to events
- Filtered views for specific use cases
- Combined metrics for deeper understanding
- Example: Breaking down calendar events by source or type
Deep Dive Layer (Power Users)
- Interaction events for detailed analysis
- Raw data for custom exploration
- Technical properties for debugging
- Example: Tracking every keyboard shortcut usage
“The implementation effort for properties is usually less than everything else. Also, I don’t decrease the user experience because properties are usually bound to an event. When I go to an analytics tool, I pick an event, then I see the properties.”
This approach allows your analytics to evolve naturally:
- Start with the essentials everyone needs
- Add properties to existing events rather than creating new ones
- Keep interaction tracking separate from product analytics
- Let power users dig deeper when needed
Remember: Just because you can track something doesn’t mean it belongs in your main analytics interface. The goal is to make data accessible while keeping the path to deeper insights clear and uncluttered.
The best analytics implementations grow like a tree - strong trunk of core metrics, with branches of additional insight available to those who need to climb higher.
Beyond Implementation: Making Analytics Tell Your Product’s Story
Connecting Analytics to Product Promise
When Vimcal positions itself as “the calendar for people with too many meetings,” it’s not just a marketing tagline - it should be the north star for our analytics design. But here’s the twist: measuring this isn’t as simple as counting meetings.
The real promise isn’t about handling many meetings - it’s about making meeting management efficient. This subtle but crucial distinction shapes our entire analytics approach.
Consider what efficiency looks like in calendar management:
- Meetings getting scheduled without manual intervention
- Quick creation of events through shortcuts
- Automated handling of video conferencing links
- Minimal back-and-forth for scheduling
“If 70% of the events get booked by using a booking link, then the person organizing the calendar doesn’t have to touch the tool at all. They just provide the link and the meetings get booked by themselves. By analyzing that, we can see that this person has a lot of meetings, but 80% are managed automatically.”
Your analytics should measure your product’s core promise, not just its features. For Vimcal, this means tracking:
- Ratio of self-scheduled vs manually created meetings
- Time saved through booking links
- Usage of efficiency features (keyboard shortcuts, templates)
- Automation adoption rates
This changes how we think about success metrics. Instead of celebrating when users create more calendar events (which could actually indicate inefficiency), we celebrate when they spend less time managing their calendar while handling the same number of meetings.
The key is to align your tracking with your promise. Don’t just measure what users do - measure how well you’re delivering on your core value proposition.
Defining Success States
Raw event data tells you what happened, but success states tell you what it means. Instead of drowning in individual events, we need to define clear states that represent meaningful moments in the customer journey.
For Vimcal, success states flow naturally from initial engagement to power usage:
First Value Moment
- Created first calendar event AND
- Sent first invitation with attendees OR
- Created first booking link
- Must happen within first 7 days
Adoption Success
- Five events created in seven days
- Booking links actively shared (not just created)
- Regular use of efficiency features
- Consistent weekly engagement
Power User Status
- Managing majority of meetings through booking links
- High usage of keyboard shortcuts
- Multiple calendars actively managed
- Steady weekly active days
“The nice thing about calendars is they can use the old hotmail trick - where you can put in a small ‘created by vimcal’ thing into the invite. Therefore if you share an invite with other people, it’s an opportunity for vim call to trigger someone to check out what this tool is.”
Rather than using vague terms like “churn prediction,” we opt for clear, actionable states:
- At Risk: Active in past but no engagement in last 2-3 weeks
- Dormant: No meaningful activity in 6-8 weeks
- Needs Attention: High meeting count but low automation usage
The key is choosing time windows that make sense for your product. For a calendar tool, weekly patterns matter more than daily ones. For other products, you might need different windows. Let your product’s natural usage patterns guide these decisions.
These states become your compass for product decisions, customer success interventions, and growth strategies.
Evolution, Not Revolution
Analytics implementation isn’t a one-and-done project - it’s a living system that grows with your product. The trick is evolving it thoughtfully without breaking what works or overwhelming your users.
Start lean and grow methodically:
- Begin with core entities and essential events
- Add properties to existing events before creating new ones
- Keep your interaction layer separate from product analytics
- Let real questions drive your expansion
“Interestingly, the longer I work on a setup, I usually tend to add more properties. This is because I get ideas about specific kinds of analyses we could do. The implementation effort for properties is usually less than everything else.”
Think about Vimcal’s video conferencing feature. Instead of creating new events when users integrate with Zoom or Google Meet, we added a “video_provider” property to existing calendar events. This gives us the data without cluttering our event list.
When to expand your analytics:
- New core product features launch
- Teams identify missing insights
- Usage patterns change significantly
- Success metrics need refinement
When to refine instead:
- Edge cases emerge
- Teams need more context
- Existing events need clarification
- Analysis reveals gaps
Remember: Every addition creates maintenance overhead and potential cognitive load for users. The goal isn’t to track everything - it’s to track the right things in the right way.
Think of your analytics like a garden. You start with strong foundational plants (core entities), add complementary elements (properties) as needed, and occasionally prune what’s not working. It’s about steady growth, not constant upheaval.
Building meaningful analytics isn’t about tracking more - it’s about tracking smarter. Through our journey with Vimcal, we’ve seen how moving beyond click-tracking to a layered approach helps us tell better product stories. Remember: your analytics should be as thoughtfully designed as your product itself. Start with your product’s core promise, build a foundation that occasional users can actually use, and let your implementation evolve naturally as you learn.
Most importantly, resist the urge to track everything. The best analytics aren’t the ones with the most events - they’re the ones that help teams make better decisions. Whether you’re building a calendar app or any other product, focus on making your analytics tell a story that everyone in your organization can understand and act upon.
This was part 4 in our series “One tracking plan a day” Season 1 - startup tools. Make sure you visit all other parts of the series:
- Notion - 27.01.25
- Slack - 28.01.25
- Superhuman - 29.01.25
- Asana - 31.01.25
- Canva - 03.02.25
- Loom - 04.02.25
- Miro - 05.02.25
- Grammarly - 06.02.25
- Replit - 07.02.25
- Hubspot - 10.02.25
- Stripe - 11.02.25
- Zoom - 12.02.25
- Ghost - 13.02.25
- Amplitude - 17.02.25
- GSheets - 18.02.25
- Lightdash - 19.02.25
- Claude - 20.02.25
- Reconfigured - 21.02.25
If you like to generate your own tracking plans by using my book with Claude AI, get your copy here:
This work is based on the chapters about event data design in my book Analytics Implementation Workbook. There, you can read more details about the D3L framework.
Join the newsletter
Get bi-weekly insights on analytics, event data, and metric frameworks.