Measuring AI productivity features - Analytics setup for Loom
Imagine spending months perfecting your product’s analytics, meticulously tracking every user action, only to have AI features completely upend your measurement strategy.
That’s the challenge many product teams face today. When Loom added AI-generated titles, summaries, and chapters to their video platform, they didn’t just add new features - they fundamentally changed how users interact with their product. How do you measure the success of actions that no longer happen? How do you track productivity gains from tasks users never needed to perform? Traditional analytics approaches fall short when measuring AI features, but there’s a way forward. Using Loom’s journey as our guide, let’s explore how to adapt our analytics strategy for the age of AI-enhanced products.
This post is part of our series exploring analytics implementations for different types of products. While previous posts focused on measuring core promises and strategic features, today we tackle a unique challenge: how to track features that often leave no trace in our traditional analytics systems.
Our journey through Loom’s implementation will reveal practical approaches for measuring AI’s impact on your product.
In this content series - season 1, I create a tracking plan for a typical start-up tool every day for four weeks (I take a break on the weekend), so 20 in total. This is the 7th one: Loom. Here is the season overview:
![]()
The AI Analytics Paradox
The Disappearing Action Problem
When building analytics for traditional features, we track what users do - clicks, submissions, completions. But AI features often work by eliminating actions rather than adding them. This creates a fascinating paradox: how do you measure the success of something not happening?
Take Loom’s auto-title feature. Previously, users would:
- Finish recording their video
- Think about an appropriate title
- Type it in manually
- Maybe revise it a few times
Now with AI, the title appears automatically. As I noted in our discussion: “The tricky thing is that AI features are often just an extension of an existing feature… Before, you had to type in the headline yourself. This is a micro action. It’s not really something significant happening here.”
This pattern repeats across AI features:
• Auto-generated chapters replace manual timestamp creation
• Smart summaries eliminate note-taking
• Suggested responses reduce typing time
The challenge isn’t just technical - it’s conceptual. Traditional analytics might track “title edited” as a sign of engagement. But with AI features, fewer edits could actually signal success. We need to flip our thinking from measuring actions to measuring outcomes.
This shifts our focus to new types of metrics:
- Acceptance rates of AI suggestions
- Time saved between recording and sharing
- Usage patterns of AI-generated content
The key is understanding that less interaction can mean more value. When measuring AI features, we’re often tracking what didn’t need to happen rather than what did. This requires a fundamental rethink of how we approach product analytics.
This disappearing action pattern will only become more common as AI features proliferate across products. The analytics challenge isn’t just adapting our tools - it’s adapting our entire mental model of what constitutes successful product usage.
The Context Shift Challenge
When AI features take over tasks, they don’t just eliminate actions - they fundamentally shift where value happens in the product. Instead of focusing on users’ interactions, we need to measure what they receive.
Consider Loom’s AI-generated summaries. The value isn’t in the generation process (a single click) but in the quality and usefulness of the summary itself. This creates a new analytics challenge: how do we measure quality at scale?
Traditional metrics fall short here:
• Click events don’t capture content quality
• Usage counts miss the effectiveness dimension
• Time-based metrics might misinterpret quick AI generations as less valuable
“From an event perspective, it’s pretty boring. It’s just like ‘message sent.’ in case of chats. There’s not really so much happening because the interesting stuff is happening in the context. And I think this makes it so tricky with tracking AI features.”
To address this shift, we need new measurement approaches:
- Content classification systems
- Quality indicators through user behaviors
- Downstream usage metrics
For example, with Loom’s summaries we might track:
- Whether users share videos with AI summaries more often
- If viewers spend more time watching videos with AI summaries
- How often summaries are used in other tools (like documents or tickets)
The key insight is that AI features force us to think beyond the “when” and “how” of user actions to measure the “what” and “why” of generated content. This requires expanding our analytics toolkit to include content analysis alongside traditional event tracking.
This context shift isn’t just a technical challenge - it’s about understanding that value now often lies in the output rather than the process.
This work is based on the chapters about event data design in my book Analytics Implementation Workbook. There, you can read more details about the D3L framework.
The Productivity Measurement Gap
Measuring productivity gains from AI features presents a unique challenge: we can’t measure what didn’t happen. When a Loom user avoids three meetings by sending quick video explanations instead, how do we quantify that time saved?
“I think there’s one use case where it’s pretty obvious. When a client has to set up something for you… I can just send off the links saying ‘Hey, I need these kinds of permissions from you. Here are five Loom videos.’ This saves me significant time.”
The challenge comes in two forms:
- Direct time savings (fewer meetings, faster content creation)
- Expanded capabilities (doing more with the same time)
Traditional metrics struggle here because:
• We can’t track meetings that never happened
• Time saved varies by user and context
• Productivity gains often compound over time
Instead of direct measurement, we need to look for proxy indicators:
- Video reuse rates (same content serving multiple purposes)
- Viewer engagement across multiple watches
- Time between recording and sharing with AI features vs without
One concrete approach is focusing on outcomes rather than time saved:
- Number of people reached per video
- Engagement rates with AI-enhanced content
- Subscription conversion rates for AI features
The key is accepting that we can’t perfectly measure productivity gains, but we can track signals that indicate whether users are getting more value from the same effort.
The “Make It Visible First” Approach
Starting with Basic Monitoring
When faced with new AI features, the temptation is to track everything. But with AI’s complexity, sometimes the best approach is starting simple and learning as you go.
“When we don’t know how to measure or how to work with it, then at least monitoring is the best solution to tackle it.”
For Loom’s AI features, this means starting with a single high-level event:
AI_productivity_used
  type: 'auto_title' | 'summary' | 'chapters'
  status: 'accepted' | 'modified' | 'rejected'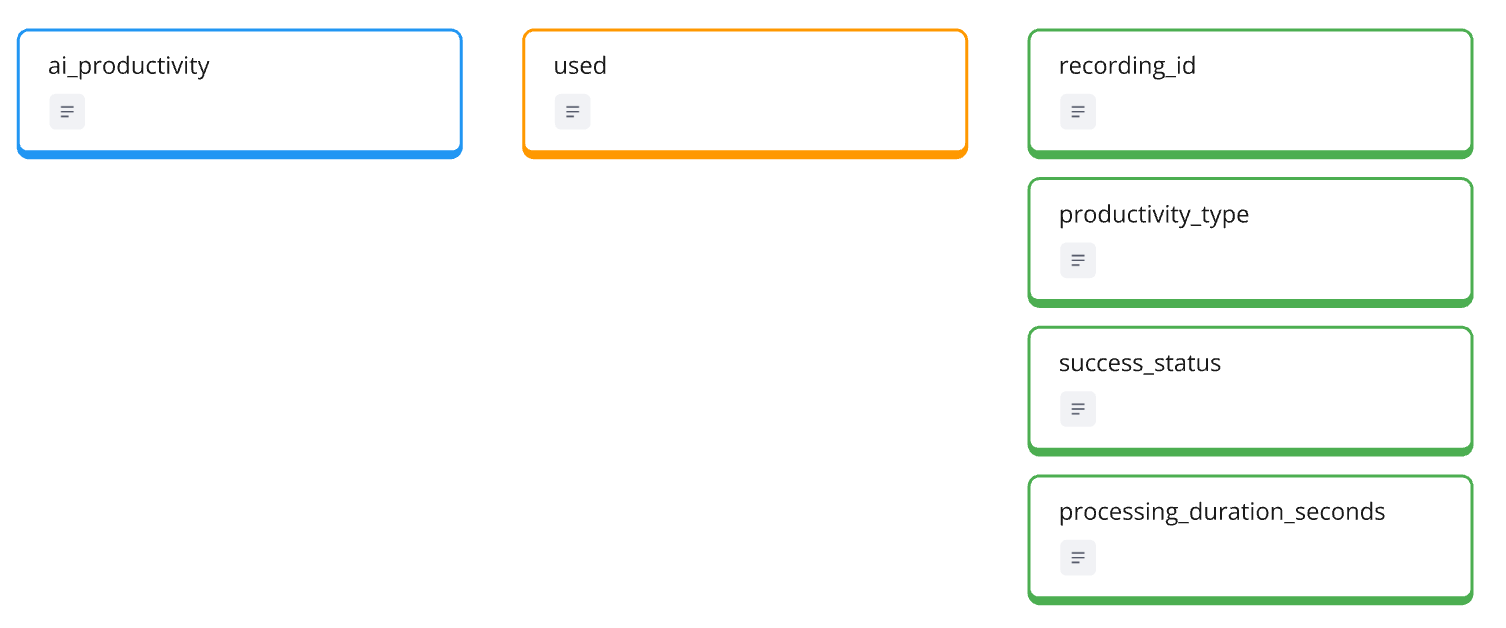
This basic structure gives us:
- Which AI features users try
- How often they’re used
- Initial acceptance rates - to be fair, you need to figure out how easy this is to figure out. If something is changed, it is easy, but if it is rejected, aka. replaced with something different is harder.
Keep the implementation lightweight:
• One event type instead of multiple
• Essential properties only
• Focus on usage patterns rather than detailed interactions
The goal isn’t perfect measurement yet - it’s understanding patterns. Are users gravitating toward certain AI features? Do they consistently accept AI suggestions? Which features see repeated use versus one-time trials?
This approach allows us to:
- Gather initial usage data quickly
- Identify which features deserve deeper tracking
- Adjust our analytics strategy based on real usage patterns
Think of it as laying a foundation. We can always add more sophisticated tracking later, but first we need to understand the basics of how users interact with AI features.
Properties Over Events
Properties Over Events
When tracking AI features, properties provide flexibility that standalone events can’t match. Instead of creating new events for every AI interaction, we can use properties to add rich context to existing product events.
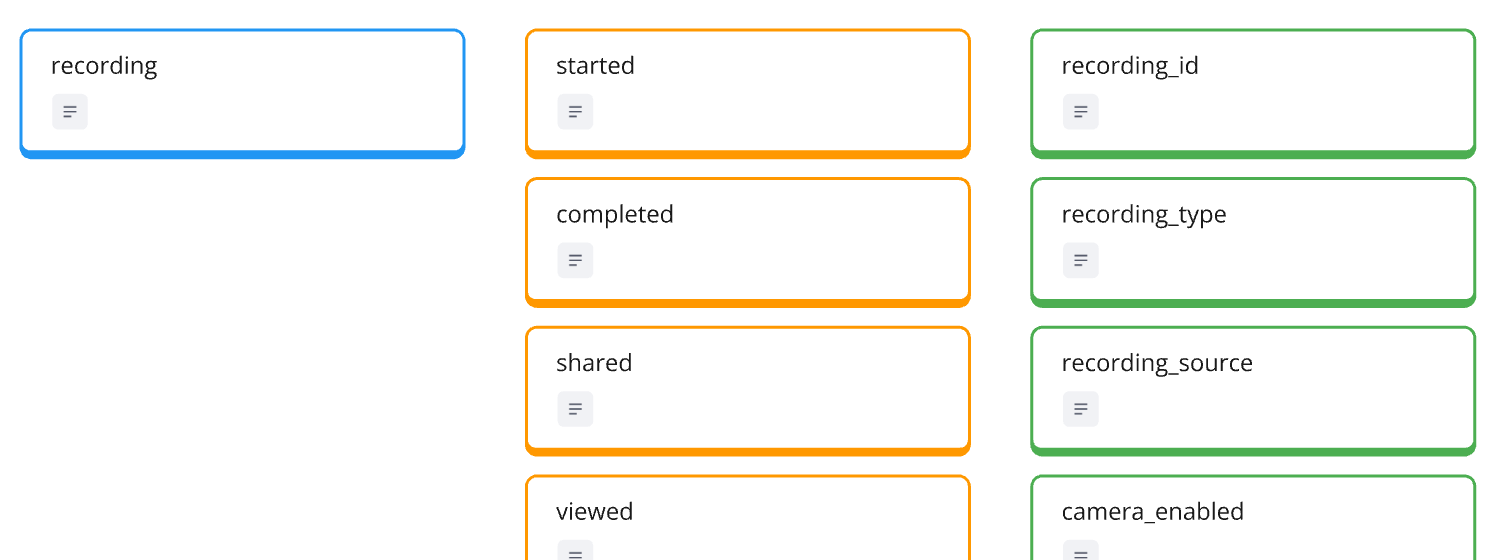
In Loom’s case, when a recording is shared, we can attach AI-related properties:
recording_shared
  ai_title_used: 'original' | 'edited' | 'not_used'
  ai_summary_used: boolean
  ai_chapters_used: boolean
This approach offers several advantages:
- Keeps the event model clean and manageable
- Makes it easier to analyze AI feature impact on core actions
- Allows for flexible evolution as AI features change
“Properties usually are not so expensive to implement… this is the first good test ground. And I might remove properties again because I really have the feeling that they don’t provide value.”
We can extend properties to capture more nuanced information:
- Quality indicators for AI-generated content
- User modification patterns
- Content classification results
The key is starting with basic properties and expanding based on actual analysis needs. For instance, if we notice users frequently modifying AI-generated titles, we might add properties to track modification patterns.
Remember: It’s easier to add or remove properties than to restructure your entire event model. This flexibility is particularly valuable with rapidly evolving AI features.
Evolving Based on Patterns
Analytics for AI features should evolve based on actual usage patterns, not assumptions. The initial monitoring phase reveals which features deserve deeper tracking and possibly their own entity status.
“I would implement this AI productivity use because there I would monitor if there is a significant uptake in usage of documents and issues… Then I can just count and see if a lot more people use this.”
Key signals to watch for:
- High adoption rates among power users
- Consistent usage patterns over time
- Strong correlation with subscription retention
- Feature becoming central to user workflows
For example, if Loom’s document generation feature shows high engagement:
AI_productivity_used
  type: 'document'
  -> frequency: increasing
  -> user_segment: 'power_users'
This might signal it’s time to promote ‘document’ to its own entity with dedicated tracking.
Evolution triggers include:
- Feature usage exceeding certain thresholds
- Clear patterns in user segments
- Strong impact on core metrics
- Emerging new workflows
Remember: The goal isn’t to track everything, but to identify and deeply measure what matters. Let usage patterns guide your analytics evolution rather than trying to predict what’s important upfront.
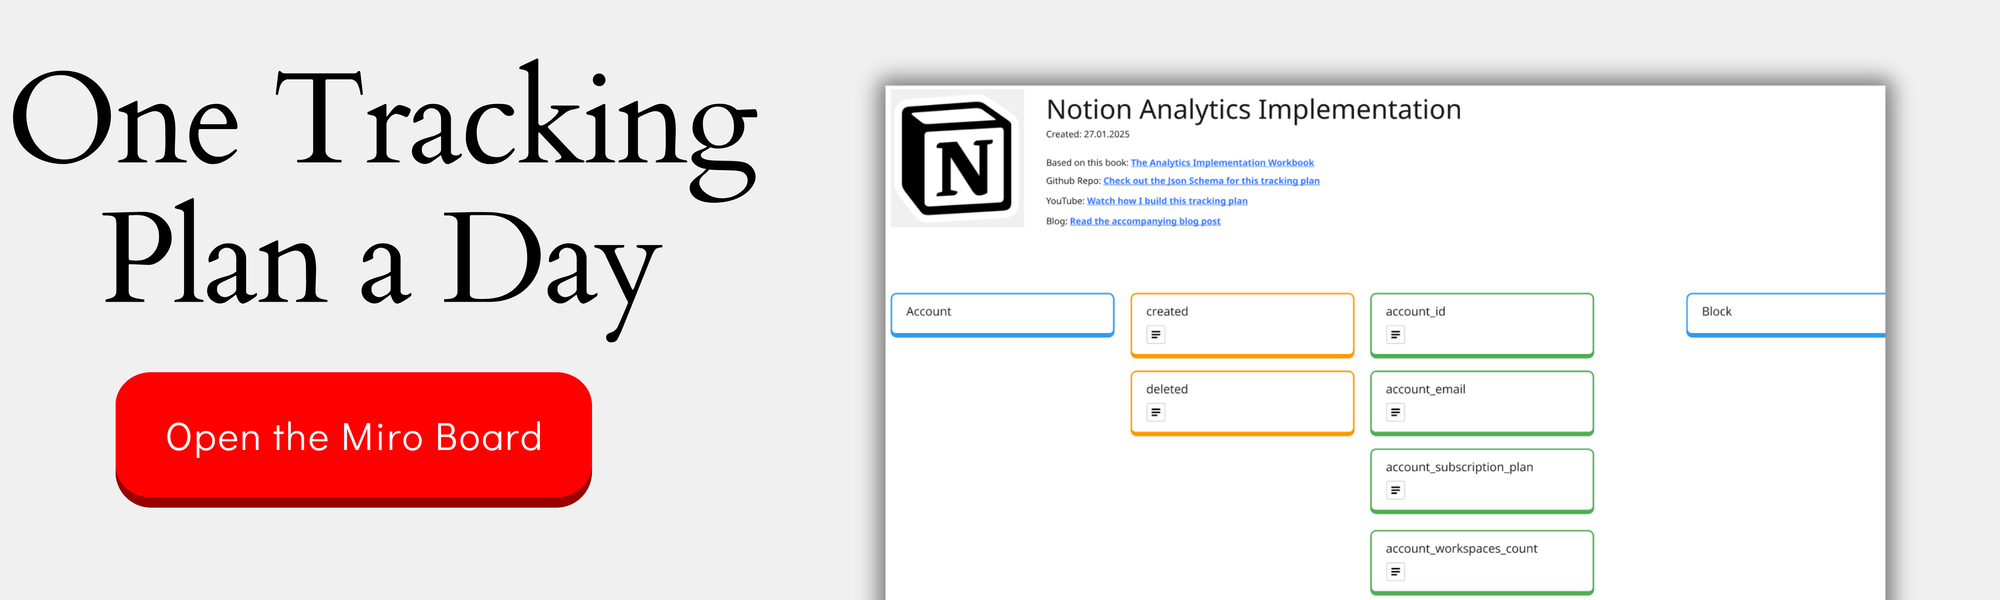
You can check out the complete design on the Miro Board:
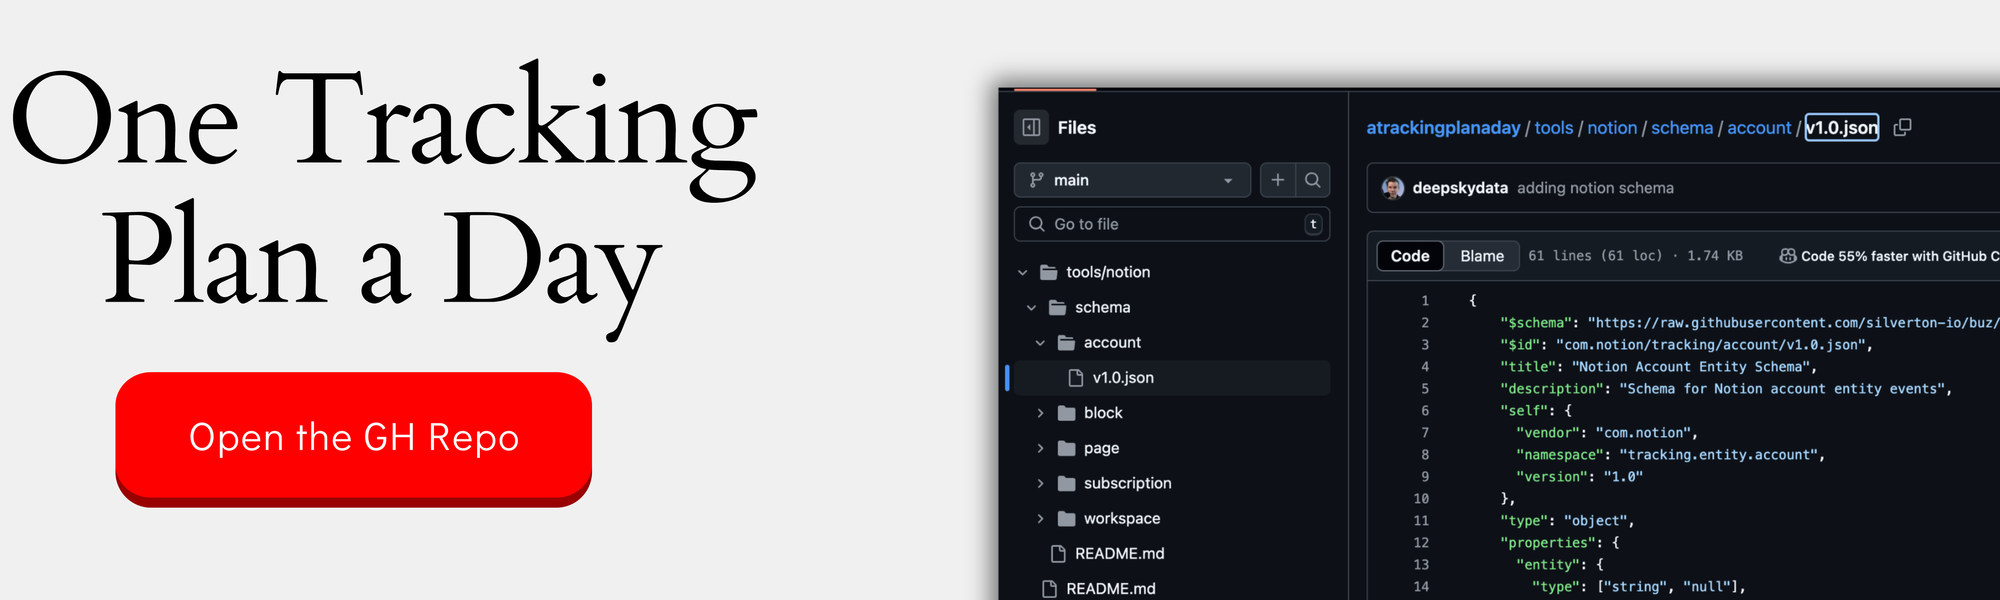
If you want the nerdy version, you can check out the JSON schemas here:
Finding Signals in the Noise
The Delta Approach
When measuring AI feature impact, the time between events can tell us more than the events themselves. For Loom, we can analyze the delta between recording completion and sharing to understand if AI features speed up the workflow.
“We could use the delta between both to try to measure if there’s an improvement when AI features are used. It’s a bit tricky because sharing maybe doesn’t happen automatically.”
Key metrics to track:
- Time from recording to sharing
- Duration between title generation and acceptance
- Speed of content reuse
Statistical considerations:
• Remove outliers (like overnight gaps)
• Account for natural usage patterns
• Compare similar content types
The delta approach helps identify:
- Workflow acceleration patterns
- AI feature adoption impact
- Productivity improvements
Make sure to focus on meaningful time gaps - not every delta matters. The key is identifying which time spans actually indicate improved workflows versus normal usage variation.
Quality Through Usage Patterns
Instead of measuring direct quality metrics for AI-generated content, we can look at how the content gets used over time. Usage patterns often reveal more about value than traditional engagement metrics.
“We can calculate how many shares of a video are happening. So in the end, we could have a property, let’s say ‘recording_shares,’ which could give us an indicator of a heavily shared recording.”
Key usage indicators:
- Multiple shares of the same content
- Repeat viewers for videos
- Content reuse across different contexts
- Addition to libraries/collections
What to track:
recording_shared
  share_count: number
  unique_viewers: number
  reuse_instances: number
  saved_to_library: boolean
These patterns help identify high-value content:
- Videos frequently shared with new team members
- Documentation content reused across projects
- Recordings that drive subscription conversions
Creating segments based on usage:
• High-reuse content creators
• Viral internal content
• Training material generators
This approach focuses on actual value delivery rather than just feature usage. When users consistently reuse and share AI-enhanced content, it signals genuine utility rather than novelty adoption.
Beyond Click Tracking: Rethinking Analytics Layers
Merging Interaction and Product Layers
Traditional analytics separates user interface actions (clicks, views) from product activities (creating, sharing). But AI features are forcing us to rethink this separation as the boundaries between interaction and product layers blur.
“Since AI is happening a lot in context and is producing this context automatically… there’s not so much really happening. So in the end, it could be that with AI features, the interaction and the product layer kind of merge together.”
The traditional layers:
- Interaction Layer: Click events, UI engagement
- Product Layer: Core product activities
- Customer Layer: Journey and success metrics
With AI features, this structure shifts:
• Less UI interaction to track
• More automated product activities
• Blurred lines between user and system actions
Take Loom’s auto-title feature:
Traditional Flow:
click → type → edit → save

AI Flow:
system generates → user accepts/modifies
This merging means we need to:
- Focus more on outcomes than actions
- Track system-initiated activities
- Use smarter properties instead of click events
The key insight is that with AI features, the “how” becomes less important than the “what.” Instead of tracking interface interactions, we focus on measuring value delivery - regardless of how that value was created.
Tracking Value Journeys
When AI reduces user interactions, we need to shift focus from tracking actions to mapping value paths. This means understanding how users progress from initial need to achieved value, regardless of the specific steps taken.
“We should focus on how the value journey looks like. What does someone have to input to achieve specific kind of value, and then really figure out how we can discover these inputs and track them.”
Key value journey components for Loom:
- Initial content creation
- AI enhancement steps
- Content distribution
- Audience engagement
- Content reuse patterns
Instead of tracking individual actions, focus on value states:
Value States:
1. Content Created
2. AI Enhanced
3. Initially Shared
4. Actively Reused
5. Team Adopted
This approach helps identify:
- Common paths to value
- Adoption patterns
- Success indicators
- Areas for optimization
The focus shifts from “what did the user click?” to “did they achieve their goal?” This might mean:
• Fewer events tracked
• Richer context properties
• More emphasis on outcome metrics
Remember: The value journey doesn’t always follow a linear path. With AI features, users might skip steps or achieve value in unexpected ways. Your analytics should be flexible enough to capture these varying paths to success.
Building analytics for AI features requires us to rethink our fundamental approaches to measurement. As we’ve seen through Loom’s example, success isn’t just about tracking what users do - it’s about understanding value delivered when AI removes the need for action entirely.
Whether you’re starting with basic monitoring today or evolving your analytics strategy for future AI features, remember: the goal isn’t to track everything possible, but to measure what matters. Focus on finding meaningful signals of value delivery, even when those signals look very different from traditional product metrics.
This was part 7 in our series “One tracking plan a day” Season 1 - startup tools. Make sure you visit all other parts of the series:
- Notion - 27.01.25
- Slack - 28.01.25
- Superhuman - 29.01.25
- Vimcal - 30.01.25
- Asana - 31.01.25
- Canva - 03.02.25
- Miro - 05.02.25
- Grammarly - 06.02.25
- Replit - 07.02.25
- Hubspot - 10.02.25
- Stripe - 11.02.25
- Zoom - 12.02.25
- Ghost - 13.02.25
- Amplitude - 17.02.25
- GSheets - 18.02.25
- Lightdash - 19.02.25
- Claude - 20.02.25
- Reconfigured - 21.02.25
If you like to generate your own tracking plans by using my book with Claude AI, get your copy here:
This work is based on the chapters about event data design in my book Analytics Implementation Workbook. There, you can read more details about the D3L framework.
Join the newsletter
Get bi-weekly insights on analytics, event data, and metric frameworks.