Product Evolution via Core Features — Miro Analytics
Imagine spending months meticulously tracking every feature of your product, collecting data on every user interaction, only to realize you’re missing something crucial: how your core product is transforming. When a product grows by adding new features - like Asana adding goals or Slack adding huddles - measuring success is relatively straightforward. But what happens when your product evolves by transforming its core offering?
This is where traditional analytics often falls short. Using Miro as our example, where a simple whiteboard has the potential to become an innovation workspace, we’ll explore the fascinating challenge of measuring not just feature adoption, but fundamental product transformation.
In this content series - season 1, I create a tracking plan for a typical start-up tool every day for four weeks (I take a break on the weekend), so 20 in total. This is the 7th one: Miro.
The Evolution Challenge: Why Measuring Product Transformation Is Different Than Feature Adoption
The Hidden Complexity of Core Feature Evolution
When we talk about product evolution, the story usually goes like this: you start with core features, then add new ones over time. Think Asana adding goals and workflows, or Slack introducing huddles. These are easy to track - you measure adoption, usage patterns, and impact. Simple enough, right?
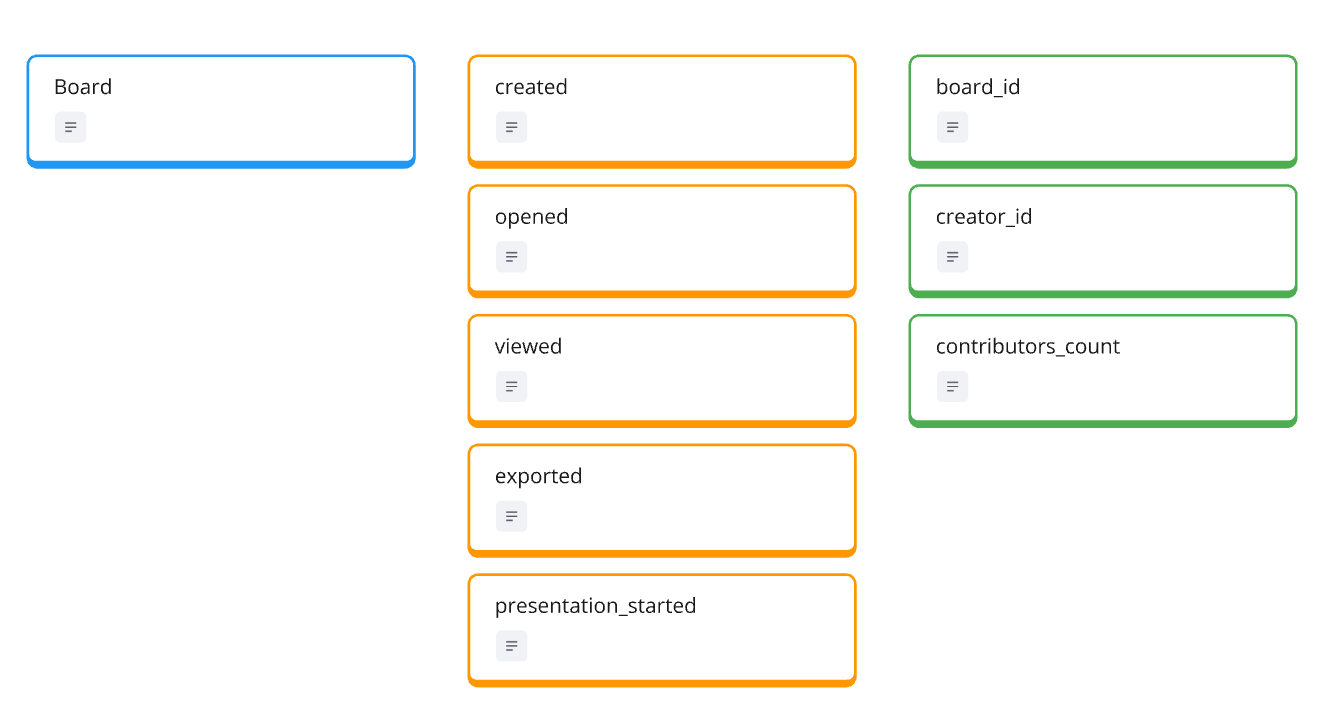
But sometimes, products take a different path. Instead of adding new features, they transform their core. This is Miro’s journey - taking their fundamental concept of a “board” and expanding what it means.
As I explained in the video: “What Miro did, or what Miro’s doing right now with their product direction, is they’re taking their core entity, the board, and making it more powerful. They extended the capabilities of the board significantly over time.”
This creates fascinating challenges:
- You’re not just tracking adoption of something new
- The same feature needs to support both simple and complex use cases
- Users might transition gradually without clear “moments” to track - because they don’t recognize the transition
- Success looks different for different types of users
Think about it like this: When Asana adds a new goals feature, it’s clear when someone starts using it. But how do you measure when a Miro board transforms from a simple whiteboard into a true innovation workspace? When does a board cross that threshold from brainstorming tool to becoming the central hub for a team’s entire project?
This is the hidden complexity of core feature evolution - measuring not just what users do, but how their entire way of working with your product transforms over time.
This work is based on the chapters about event data design in my book Analytics Implementation Workbook. There, you can read more details about the D3L framework.
The Limits of Traditional Feature Analytics
Traditional analytics loves clean, countable moments. A feature gets launched, users try it, some adopt it - metrics go up or down. But when you’re transforming a core feature like Miro’s board, these clean moments disappear. You can’t just count how many people “activated” the innovation workspace feature because it’s not a switch that gets flipped.
“I think we still have to find what actually defines this,” as I mentioned in the video. “We don’t know yet which kind of patterns we can put into activities. This is where I want to get to.”
The usual analytics approaches fall short in several ways:
- Click tracking becomes meaningless (who cares if someone clicked a button when you’re trying to measure workspace transformation?)
- Feature adoption metrics don’t capture evolution of use
- Simple counts (like number of assets on a board) create too much noise without signal
Here’s a real example: Let’s say we track that a team added documents, tasks, and comments to their Miro board. Traditional analytics would just show us increased feature usage. But what we really want to know is: Has this board become their primary workspace? Are they actually collaborating here instead of jumping between multiple tools?
Even more challenging: success isn’t always about doing more. A team effectively using Miro as an innovation workspace might actually have fewer individual interactions because they’re working more efficiently. Traditional metrics might flag this as decreased engagement when it’s actually a sign of success.
This is why we need to move beyond traditional feature analytics. When your core feature is transforming, you need analytics that can capture not just what users do, but how their entire workflow is evolving.
Finding Signals in Transformation
When you can’t measure transformation directly, you need to look for signals that indicate it’s happening. This isn’t about finding one perfect metric - it’s about combining multiple signals that together tell the story of how a board is evolving from a simple whiteboard to an innovation workspace.
“We have to track a lot of different properties, play around with the analyses to see if they indicate and give us a signal that something is moving into an innovation workspace,” as I explained in the video. “This is what I mean by experiments.”
Here’s what these signals might look like:
Time and Engagement
- Implementing heartbeat events to measure true time spent on boards
- Looking for sustained engagement rather than just brief interactions
- Tracking patterns of return visits and session length
Collaboration Patterns
- Number of active contributors on a board
- Mix of different activity types (documents, tasks, comments)
- Cross-team participation and interaction
Quality of Use
- Types of assets being created and used
- Evidence of structured work (like task management)
- Signs of long-term project organization
The key is combining these quantitative signals with qualitative insights from your product team. When they conduct user interviews or testing sessions, these become gold mines for identifying new patterns to track. Listen for how teams describe their evolving use of the product - these descriptions often hint at measurable signals you can track.
Remember: We’re not looking for perfect measurements, but for strong indicators that together tell us how usage is transforming. Sometimes the best signals come from unexpected places, which is why we need to stay flexible and experimental in our approach.
From Simple Board to Innovation Hub: Building Analytics That Grow With Your Product
Choosing Your Heartbeat Entity: Why the Board Beats the Asset
When building analytics for the product transformation, your first crucial decision is to be aware of your heartbeat entity. In Miro’s case, we face an interesting choice: should it be the asset (like sticky notes, shapes, or documents) or the board itself?
“If we would take this into account for Miro, it would be the asset because we are constantly adding assets along the way. But the asset, I think, is too weak to be the heartbeat,” as I explained in the video. “The real value for me just comes when someone shares a board or presents a board.”
Think about it like this:
Value Generation:
- Assets alone don’t tell us if someone got value
- A board being shared or presented shows clear value delivery
- Success comes from collaboration, not just creation
Scale Consideration:
- Assets are too granular - you might have hundreds per board
- Boards represent complete units of work
- Easier to connect boards to business outcomes
Most importantly, the board is where transformation happens. A single sticky note doesn’t evolve into an innovation workspace - but a board can grow from simple brainstorming to becoming a team’s central collaboration hub.
This is why your heartbeat entity choice should align with where value actually happens in your product. In Miro’s case, the board isn’t just a container for assets - it’s the space where collaboration and innovation come to life.
Building Your Property Foundation
Once you’ve established your heartbeat entity, the next step is designing properties that can capture transformation without creating analytical chaos. The key is finding the right balance between detail and usability.
“Don’t do properties with too many variations. These are usually not really useful,” I emphasized in the video. “You should always have properties without so many variations. This is important.”
Properties are great for spreading out new sensors for gathering data that could potentially unlock new insights to understand some signals of the product transformation.
Here’s how to approach it:
Smart Property Design:
- Use clustering instead of raw numbers (e.g., “50-100 assets” vs exact counts)
- Create clear categories that won’t explode with variations
- Focus on properties that indicate workspace evolution
For a Miro board, key properties for the transformation might include:
- Number of active contributors
- Types of advanced assets being used (documents, tasks, etc.)
- Collaboration patterns (like cross-team involvement)
- Activity density (how many edits in recent periods)
The trick is avoiding the temptation to track everything. Instead of creating a property for every possible board characteristic, focus on those that actually indicate transformation. For instance, knowing a board has exactly 247 assets isn’t as valuable as knowing it has a healthy mix of documents, tasks, and collaborative elements.
Remember: Properties should make analysis easier, not harder. If you find yourself struggling to make sense of a property in your analysis, it might be too complex or not actually meaningful for measuring transformation.
Smart Extension Through Experimentation
When measuring product transformation, you need a systematic way to extend your analytics that maintains clarity while discovering new insights. This is where smart experimentation with tracking comes in.
“It’s not really like a structured experiment,” I explained in the video. “It’s more like you come up with specific properties to derive specific proxy metrics. Then you see if they stick and work, if they actually create something meaningful.”
The heartbeat event is a perfect example of smart extension:
- Send an event every 10-30 seconds while a board is active
- Track duration through a simple property (heartbeat_in_s)
- Calculate a simple metric: avg. board view time
- Keep the implementation light but the insights powerful
- Use it to understand true engagement patterns
Your experimentation approach should follow these principles:
Start Broad, Then Focus:
- Begin with wider property tracking to discover patterns (don’t do this for entities and activities)
- Keep what proves meaningful, remove what doesn’t
- Let real usage guide your analytics evolution
Combine Multiple Signals:
- Mix heartbeat data with activity patterns
- Look at both individual and team behaviors
- Connect quantitative data with qualitative insights from user interviews
The goal isn’t to track everything perfectly from day one. Instead, you’re building a flexible system that can evolve as you learn more about how users are transforming their use of your product. Some experiments will fail - that’s fine. The key is maintaining a clear structure while remaining open to discovering new signals of transformation.
You can check out the complete design on the Miro Board:
If you want the nerdy version, you can check out the JSON schemas here:
Beyond Metrics: Creating Analytics That Support Product Vision
Balancing Discovery and Definition
When measuring product transformation, you need to balance two distinct phases: initial discovery of what matters, and defining clear metrics once you understand the patterns. This isn’t a linear process - it’s an evolution that requires patience and flexibility.
“We need to combine quantitative data and qualitative data,” I emphasized in the video. “To really understand how a use case or jobs-to-be-done works, I always come up with clear metrics. You can always start out with exploring, but at some point, you have to come up with clear metrics.”
The Discovery Phase:
- Implement broader tracking through properties (not entities or activities)
- Gather data without strict definitions
- Stay open to unexpected patterns
- Work closely with product teams to understand user behavior
The Definition Phase:
- Move from noise to clear signals
- Define concrete success metrics
- Remove or refine properties that weren’t useful
- Create focused measurements of transformation
The key is knowing when to transition between these phases. Start broad enough to catch important signals, but don’t stay in discovery mode forever. Once you see clear patterns emerging - like specific ways teams use boards as innovation workspaces - it’s time to define more concrete metrics.
Remember: Good analytics start with curiosity but end with clarity (after that you can move to curiosity again). Your goal is to move from “what might indicate transformation?” to “these are our clear signals of success.”
Bridging Analytics and Product Strategy
Analytics isn’t just about tracking what happens - it’s about supporting your product’s strategic evolution. For Miro, this means helping product teams understand if their vision of the innovation workspace is becoming reality.
“Therefore, we need to track if there are actually some indications from the event data that people pick this up,” I noted in the video. “This is why I talk so much about proxies, how we can actually measure this.”
A successful bridge between analytics and strategy requires:
Working With Product Teams:
- Listen to user interviews for patterns
- Understand the qualitative signs of transformation
- Identify behaviors that could be measured quantitatively
- Create metrics that reflect strategic goals
Looking for Strategic Signals:
- Track transition from basic whiteboard to workspace hub
- Measure depth of team collaboration
- Monitor evolution of board usage patterns
- Identify signs of broader workspace adoption
Your analytics should tell product teams not just what users are doing, but whether the product is evolving as intended. For instance, increased view time combined with diverse asset types might indicate a board has become a true workspace rather than just a whiteboard.
The goal isn’t to prove your strategy is working, but to provide clear signals about how users are actually adopting your product’s evolution. Sometimes these signals will support your plan, sometimes they’ll suggest new directions - both are valuable insights.
Maintaining Clarity as You Scale
The hardest part of measuring product transformation isn’t setting up the initial tracking - it’s maintaining clarity as your analytics grow and evolve. You need a system that can scale without becoming overwhelming.
“You have to clean up properties over time,” I explained in the video. “If we feel that some properties are not really useful in analysis, we have to get rid of them or redo them.”
Keep your analytics clear with these principles:
Regular Maintenance:
- Review and remove unused properties
- Consolidate similar metrics
- Update property structures as needs change
- Keep documentation current
Smart Property Management:
- Use clustering instead of endless variations
- Keep property values manageable
- Focus on meaningful breakdowns
- Avoid redundant tracking
Most importantly, remember that not every product change needs new tracking. When Miro adds a new export format or asset type, that might just be a new property value rather than a whole new event to track.
Think of it like gardening - regular pruning keeps things healthy and manageable. Don’t be afraid to remove tracking that isn’t providing value. It’s better to have fewer, clearer metrics that everyone understands than a complex system that nobody uses effectively.
The goal is sustainable analytics that grow with your product. By maintaining clarity and focus, you ensure your analytics continue to provide valuable insights about your product’s transformation, even as the product itself evolves.
Measuring product transformation isn’t about tracking more - it’s about tracking smarter. When your core feature evolves, like Miro’s board expanding from simple whiteboard to innovation workspace, you need analytics that can grow and adapt with your product. By focusing on meaningful signals, building flexible but maintainable tracking systems, and connecting analytics to product vision, you create insights that truly matter.
The goal isn’t to track every possible interaction, but to understand how your product is transforming in the hands of your users. After all, the most powerful analytics aren’t the ones with the most events or properties - they’re the ones that help you understand and support your product’s evolution.
This was part 8 in our series “One tracking plan a day” Season 1 - startup tools. Make sure you visit all other parts of the series:
- Notion - 27.01.25
- Slack - 28.01.25
- Superhuman - 29.01.25
- Vimcal - 30.01.25
- Asana - 31.01.25
- Canva - 03.02.25
- Loom - 04.02.25
- Grammarly - 06.02.25
- Replit - 07.02.25
- Hubspot - 10.02.25
- Stripe - 11.02.25
- Zoom - 12.02.25
- Ghost - 13.02.25
- Amplitude - 17.02.25
- GSheets - 18.02.25
- Lightdash - 19.02.25
- Claude - 20.02.25
- Reconfigured - 21.02.25
If you like to generate your own tracking plans by using my book with Claude AI, get your copy here:
This work is based on the chapters about event data design in my book Analytics Implementation Workbook. There, you can read more details about the D3L framework.
Join the newsletter
Get bi-weekly insights on analytics, event data, and metric frameworks.