2.1 The Five Steps to Event Data Nirvana
What Is Event Data Nirvana?
Disclaimer: It sounds a bit esoteric on this page, but stay with me. I am serious about this. Some people overused the term Nirvana (some because of one of my all-time favorite bands). But it is the right one for us to move forward:
“All Indian religions assert it to be a state of perfect quietude, freedom, highest happiness as well as the liberation from attachment and worldly suffering”

Let’s transfer this to event data.
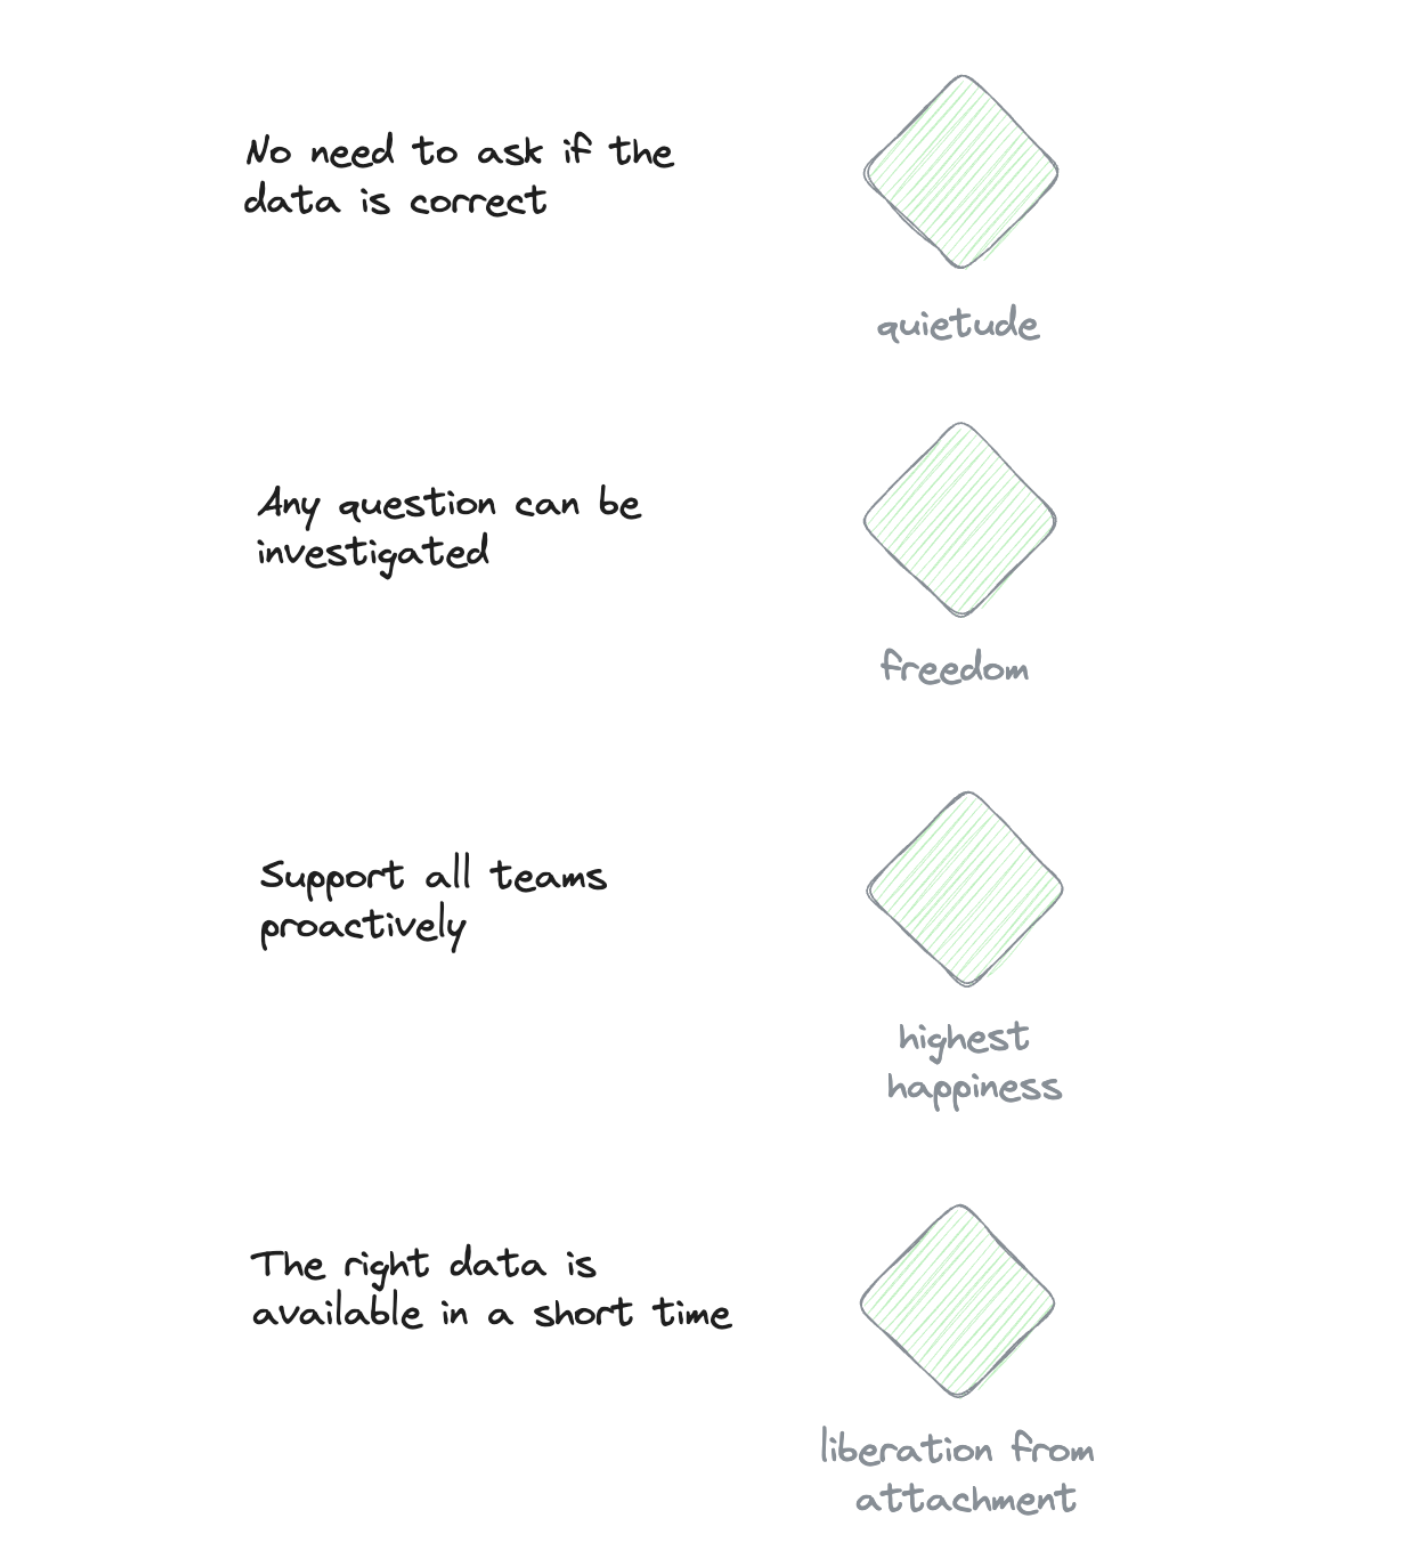
Event data nirvana is a state where:
- No one asks anymore if the data is correct (quietude)
- The right data is ready or can be made available in a short time — less than two weeks (liberation from attachment and suffering)
- Any of the weirdest business questions can be investigated with event data (freedom)
- As an analyst, you can support your team with proactive, on-time level-ups (highest happiness)
Ok, I want to get there. You too? So how do we get there?
We need to practice — a lot of practice — and practice the right things. Let’s have a look.
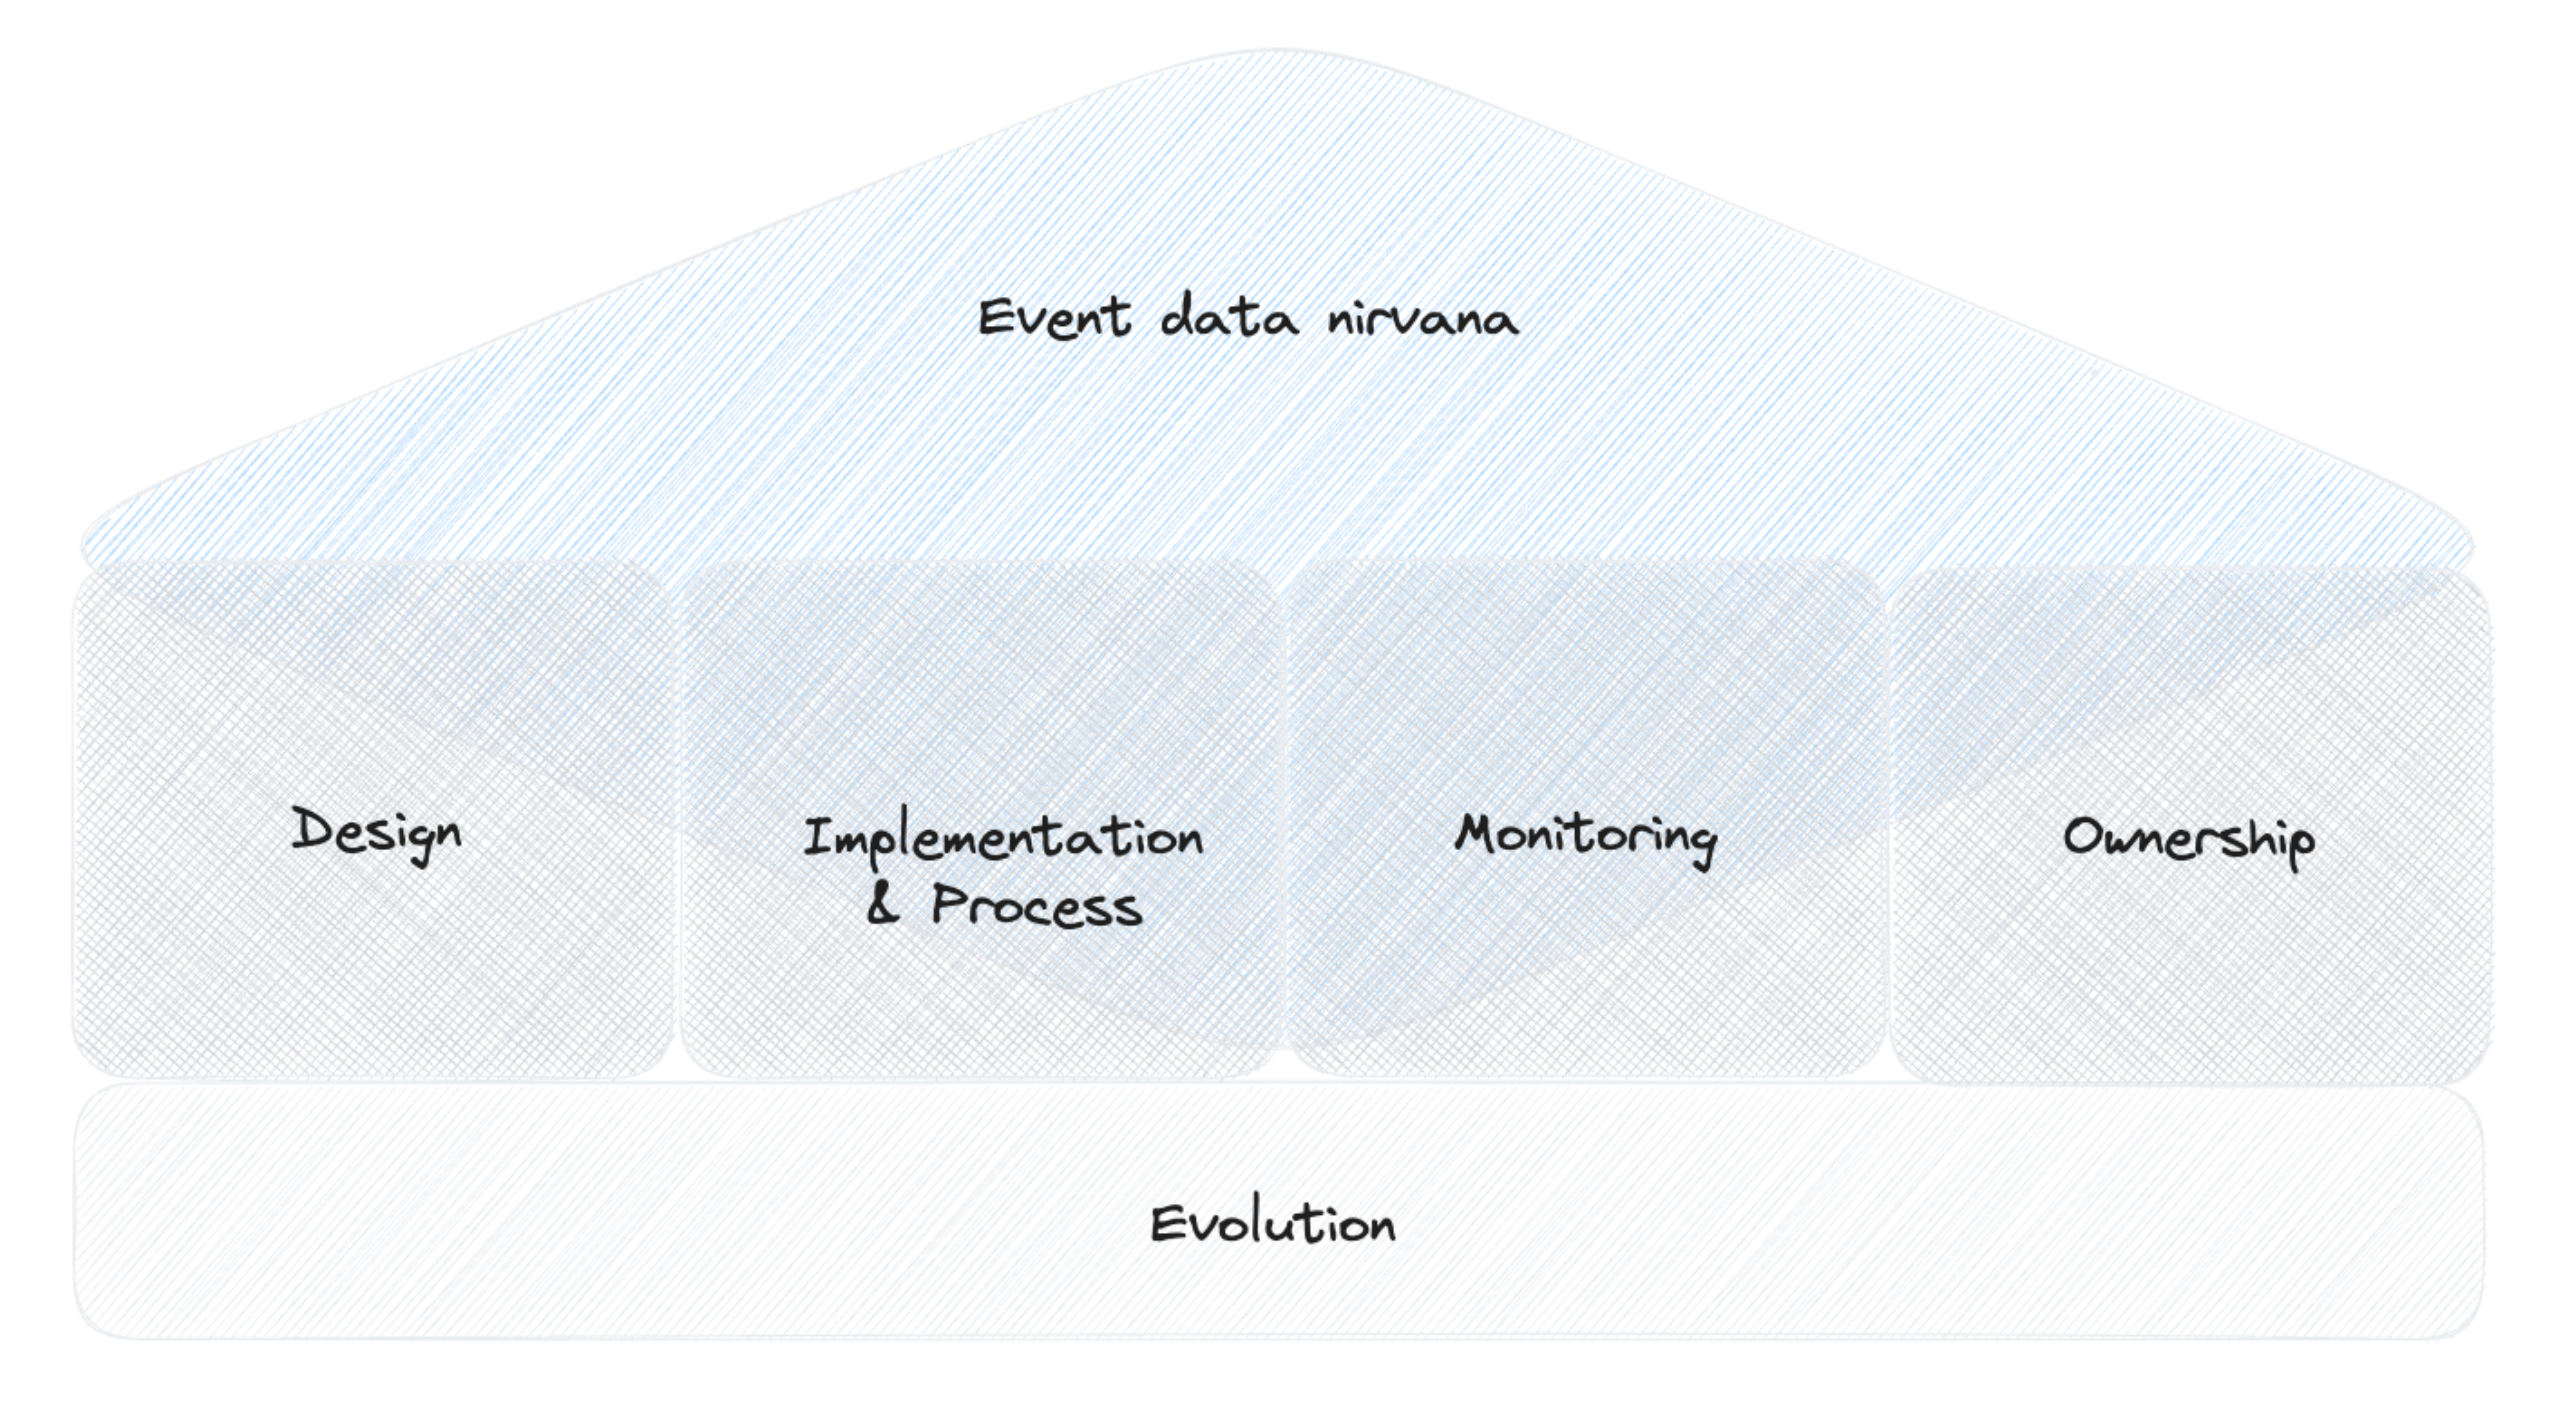
Step 1: Design
This is where we lay the foundation of a really good setup. And this is also the place where things can go fundamentally wrong. This is why these parts get a lot of attention from me in this book.
With the right design decisions you can prevent plenty of issues in the future already in the initial setup. And it not only prevents bad things. It also creates a fast and clear path to value that you can provide with event data.
So does this only work for new setups? No, you can develop a design at any time and use it as a blueprint or a plan that you use for all the next steps and future event data work.
So we will start to talk about design by defining criteria that allow us to judge a design. And, of course, a design is not a one-time effort. It evolves, and this is even so important that it gets its own step.
Step 2: Process & Implementation
“Unfortunately” your business and your product are changing every day. Sometimes in small increments of features or growth activities. Sometimes with a bold and big new feature or extension to your business.
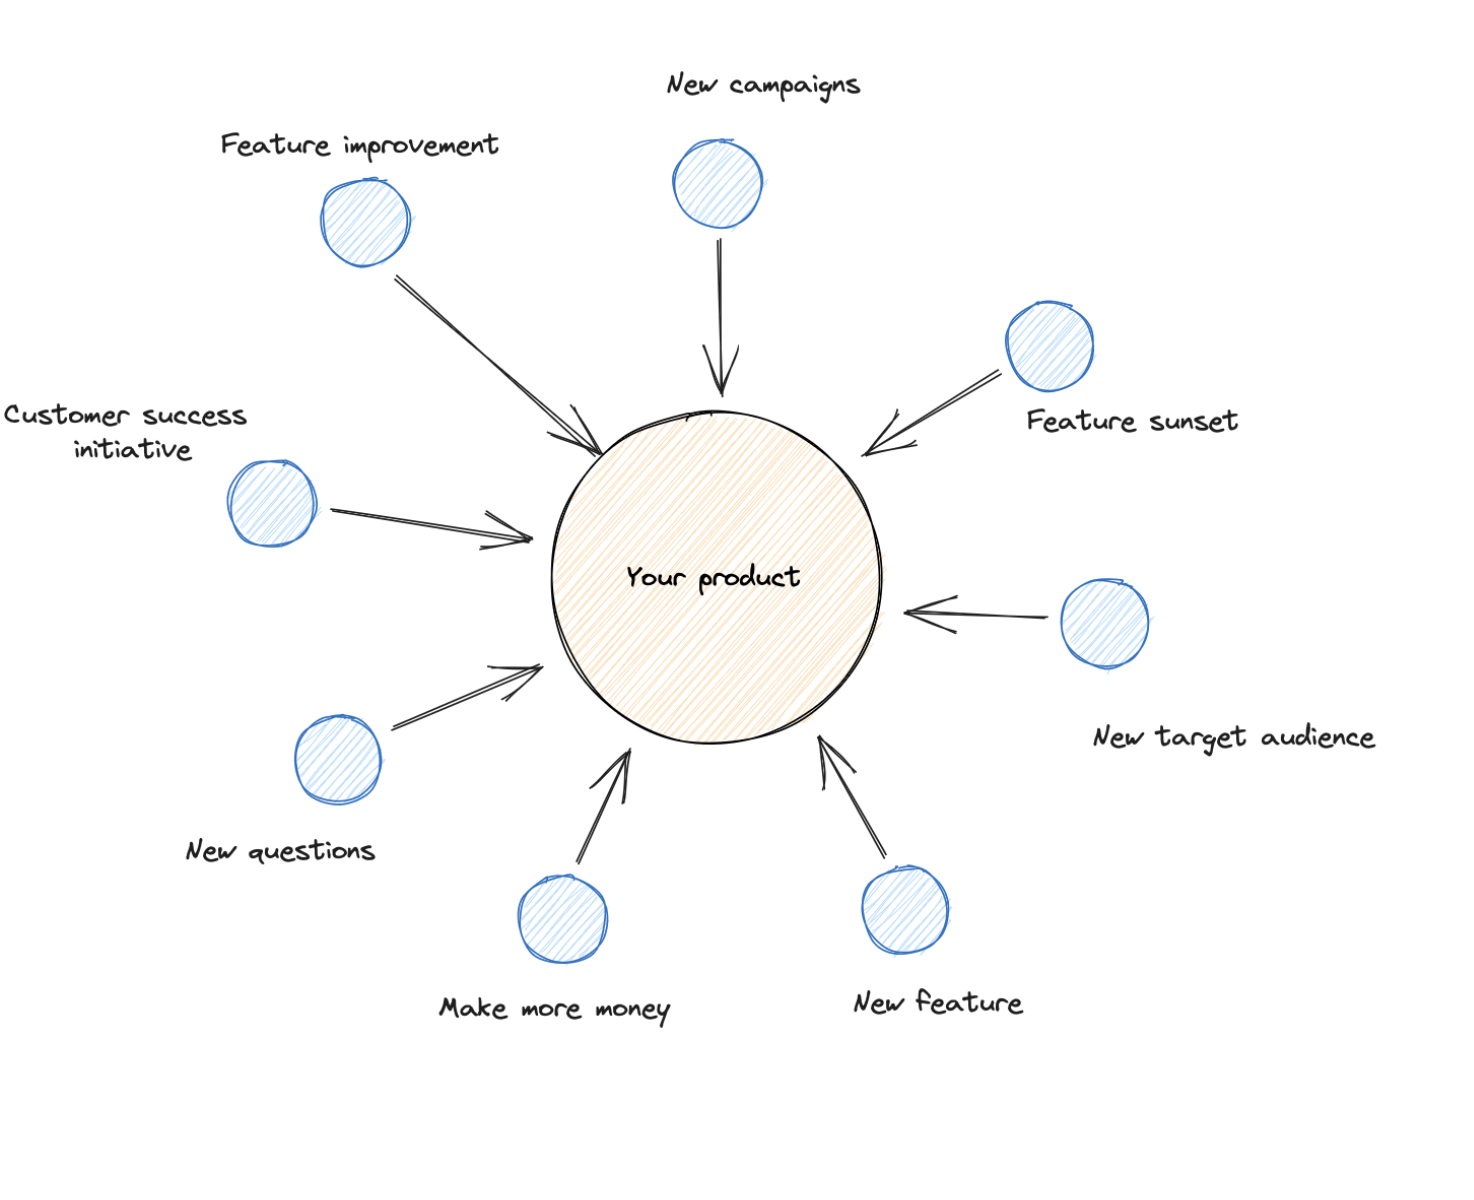
At the same time, some things go away: feature interactions, whole features, and growth flows.
When these changes are happening, your event data needs to change too, when you want to analyze the performance of new feature iterations.
But not only this is driving change. Often you have new questions, maybe you are interested in some details of a feature (was a task, story, or epic created). To do so you need to extend the event data.
So when change is natural, you need a process in place to manage the change. This process should enable:
- A quick implementation of the change
- Maintain the quality standards
- Avoid duplicates
- Documentation of the implementation
The implementation itself is the core step of the process. There are different ways to track or collect events; picking the right one has to be part of the process:
- When to use server-side tracking
- When to get events from database actions or streams
- When to work with explicit auto-tracking
Step 3: Monitoring & Testing
Once designed and implemented, some events become so important to you that you want to make sure you don’t break the implementation of them.
This is an additional process and will extend the implementation process, but it is worth the effort for your core events.
This can be combined with monitoring on a test stage to quickly do cross-checks if there are issues with the new release.
Step 4: Ownership
We have tools (all the tools that can collect the event data), and we have processes, so now we need to involve people to get a full setup.
Ownership for event data is one of the most crucial things, and it is often overlooked.
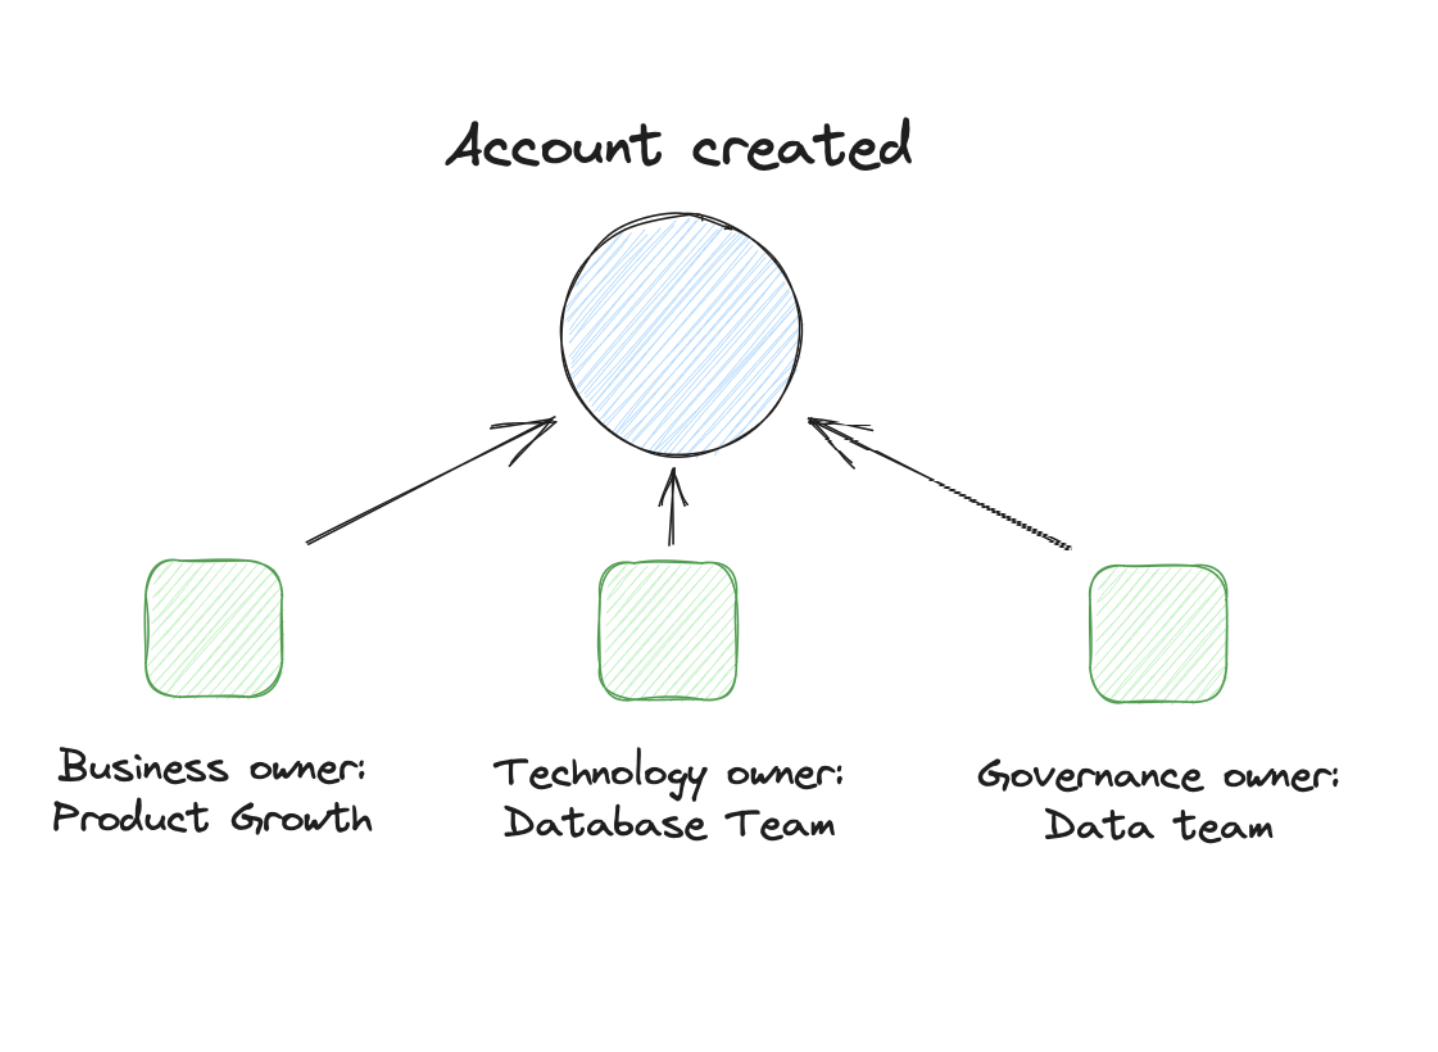
There is simple ownership like one person or one team that is responsible for the definition and the process of event data. Or there can be shared ownership: business, technical and domain.
We will lay out what ownership means: what responsibilities are required, which actions and limitations.
Step 5: Evolution
As mentioned for the process, your event data setup needs to evolve.
Some changes are driven by your business and product activities. But the real evolution goes beyond that and is the meta-process that aligns the current setup with the value and impact it creates.
Evolution also holds the decision about what tools you will use and introduce.
An essential part of the evolution is the enablement of all stakeholders that work with event data. These can be training, documentation, office hours, or evangelism within the company.
The Creating Value & Impact Step — aka Nirvana
As you can see, all the steps before require quite some work and effort to implement them. So we must ensure that it creates the value that justifies all these efforts.
As we already mentioned in the design, there is no right or wrong about all parts mentioned as long as it works and creates value. But how do we know that?
Therefore we will start with establishing a measurement framework that lets us evaluate our current setup constantly and see where we need to adapt it.
2.2 Connecting to Business Strategy
We Need to Talk About Data Strategy
This is a black spot for me. I ignored this for years. Not that I wasn’t aware of the existence of data strategy. For me, it was just something that these well-paid PowerPoint consultants did to get management buy-ins.
I usually started projects when these buy-ins already existed (or at least I believed they did exist).
But to be honest, this was a big miss.
Taking plenty of steps back from my operational work and discussing the issues with people we discover in this work, a lot comes down to the data strategy.
The Problem with Data Strategies
And there is a problem with data strategy in general. And this comes back to the PowerPoints I knew. These Data Strategies are often useless.
They are generic and loosely connected to the actual business case and the company’s state.
They usually paint some ideal vision of a data-driven organization that, to be honest, exists only on paper.
Unfortunately, I never got my hands on a really good data strategy. This would have most likely changed my opinion about it.
So, we continue with my approach: when I don’t get existing approaches, I start with my own picture.
What Is the Goal of a Data Strategy?
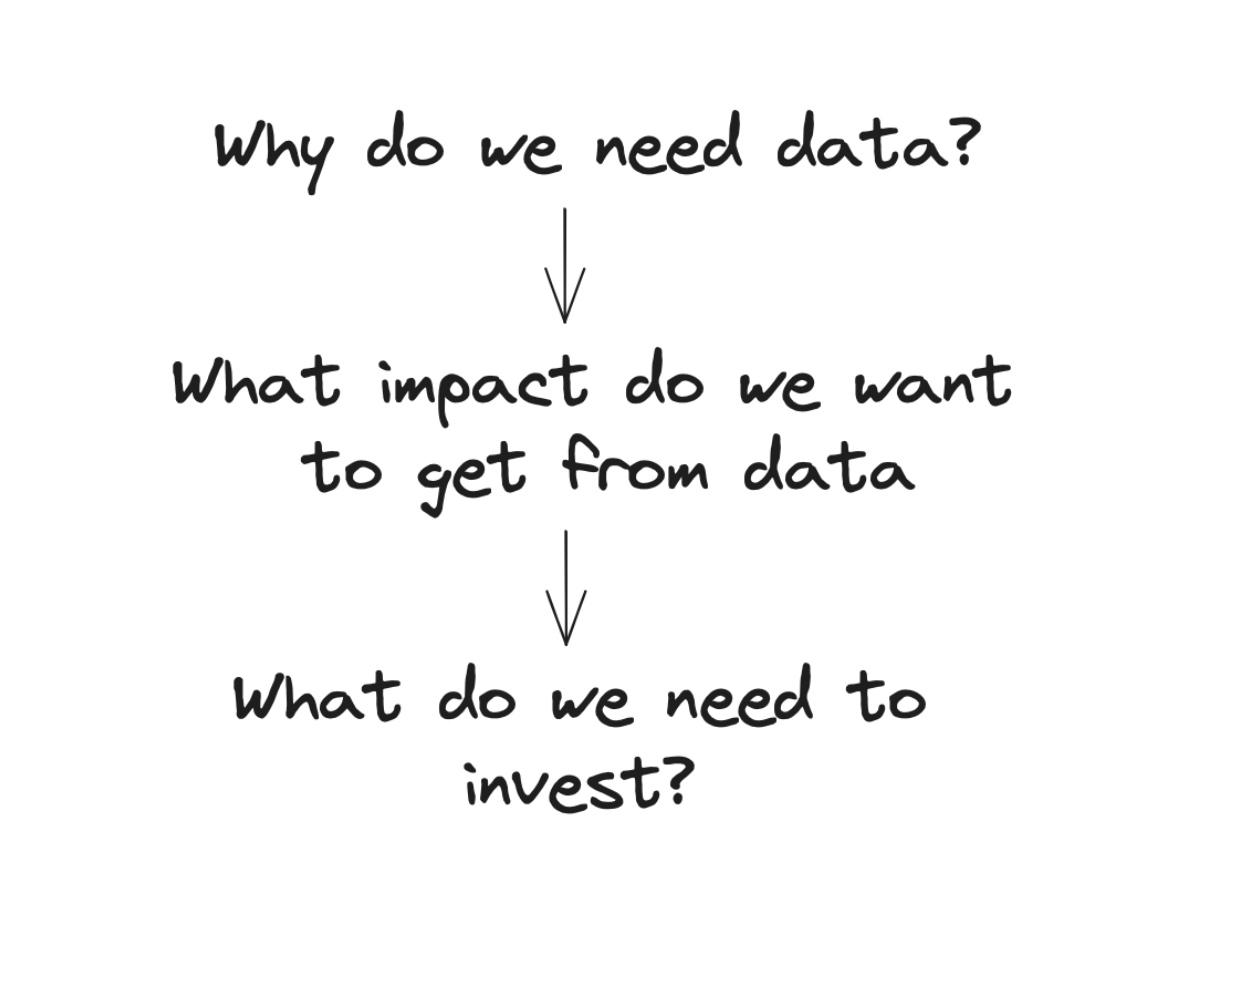
I start with my main objective of a data strategy: Get everyone in the company aligned on what should be achieved with data.
We define the role that data should play in the company and in which process it should be available for decisions.
With these definitions, we at least know why we need data. This is a good starting point for us to know how we invest in a data setup.
Because, surprise, companies over centuries were running the business with very little data (ask your accounting team about it). We need to know how we want to go beyond this and what value we expect from it.
Connecting to Your Business Strategy
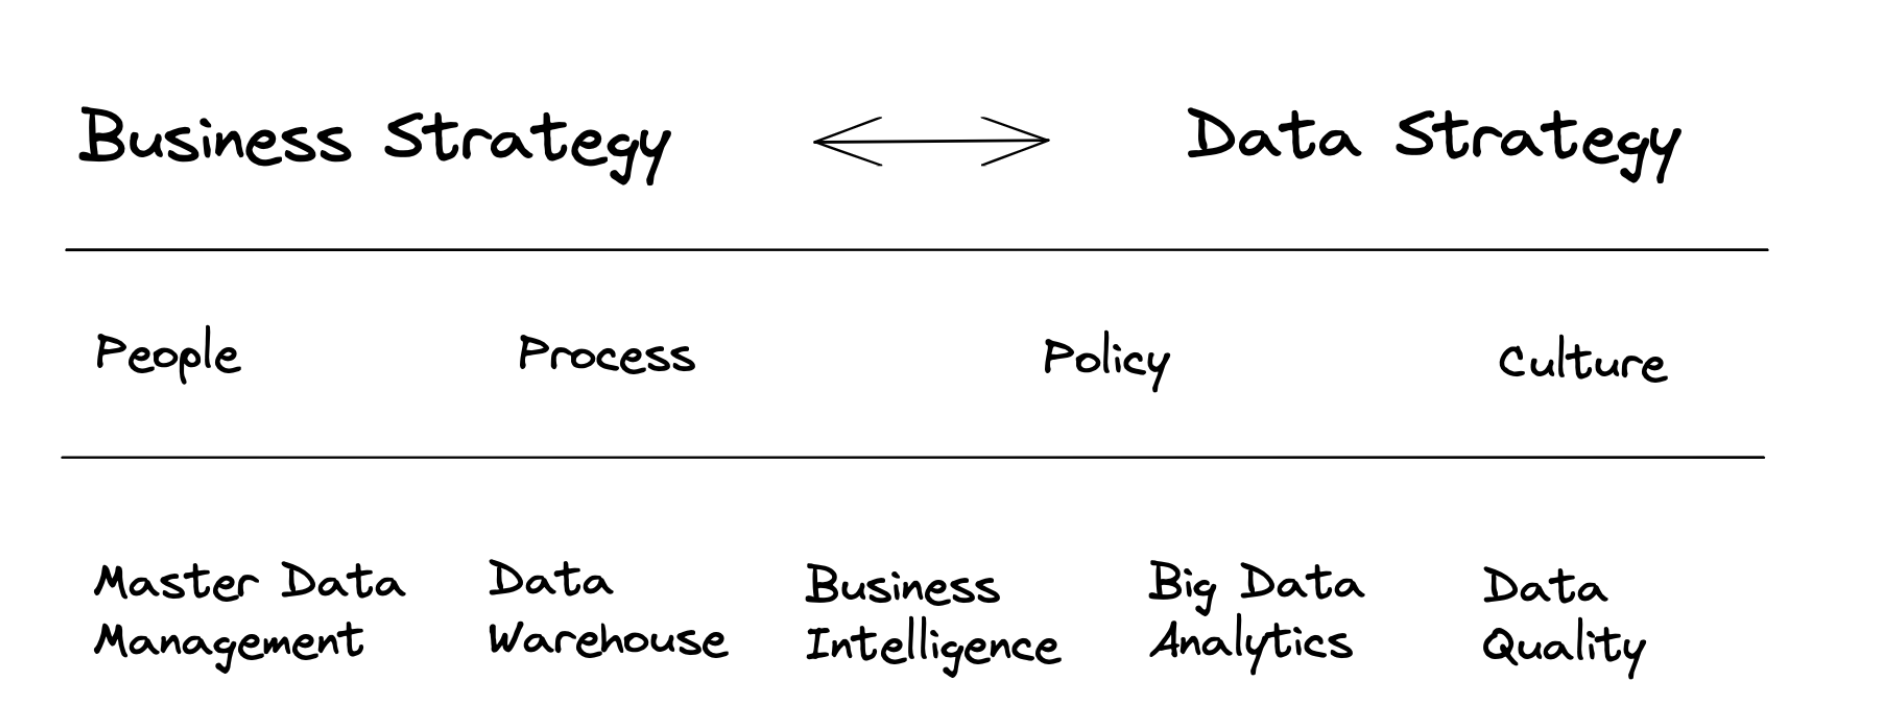
Any data strategy does not exist in a void. It is embedded in your company; therefore, anything you do with your data strategy has to be aligned with the business strategy.
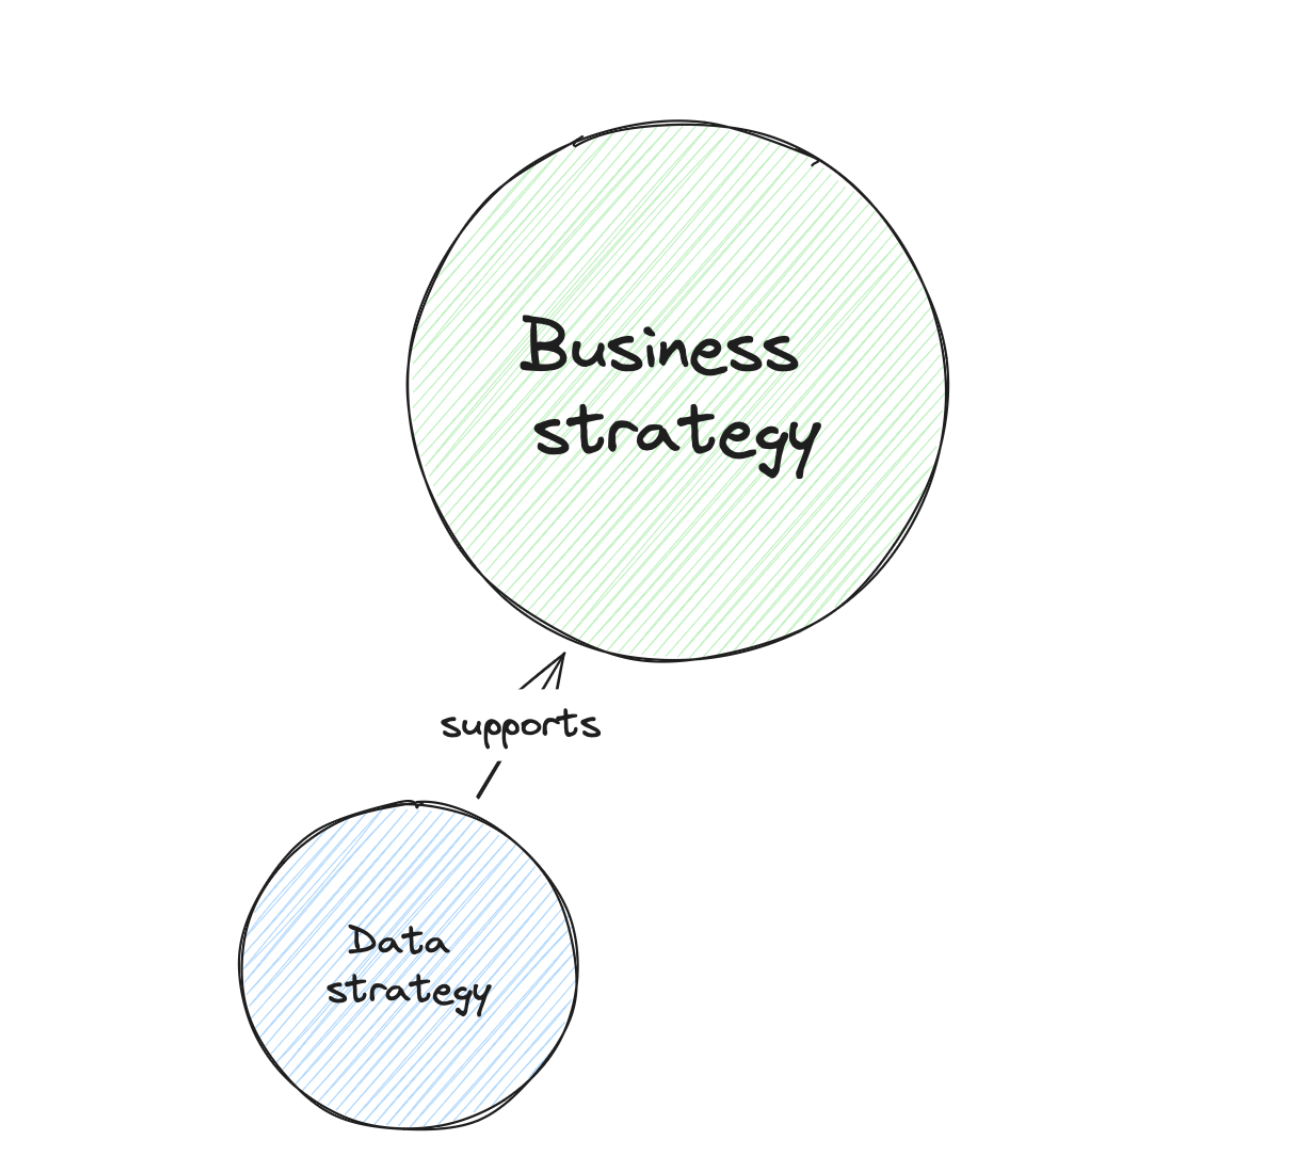
Any data strategy does not exist in a void. It is embedded in your company; therefore, anything you do with your data strategy has to be aligned with the business strategy.
Depending on the size of your company, you might not look at the high-level business strategy but at your department’s goals. Check with which business teams you are working; this is your first line to understand their goals.
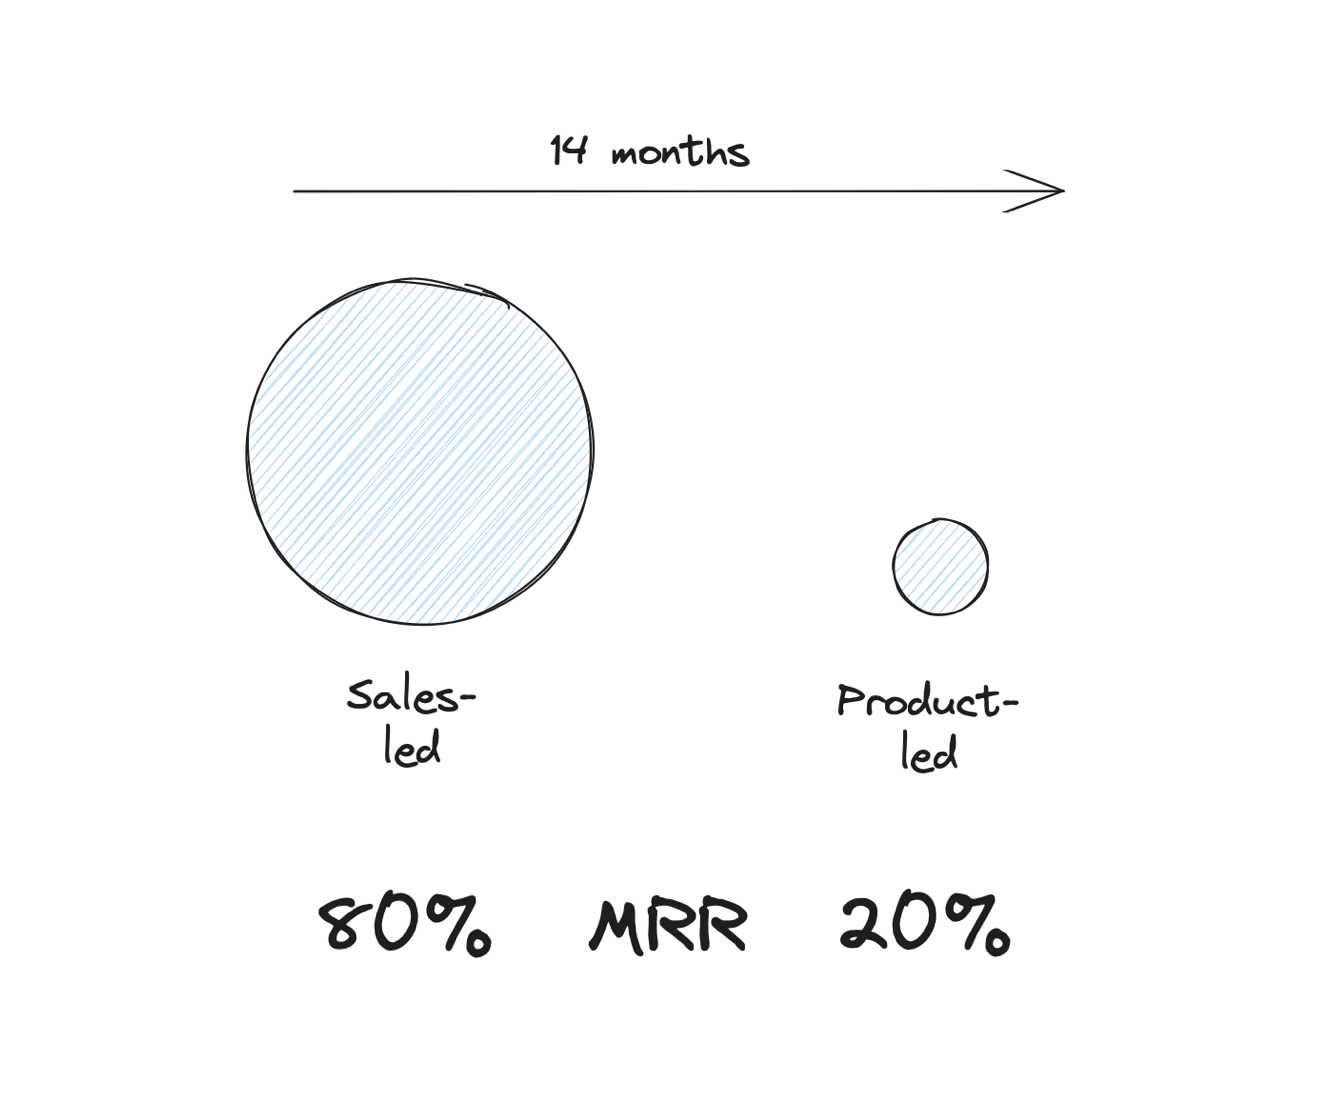
A startup just raised its seed round, so we assume that there is product-market fit. The next 14 months are to prove that the company can scale in this market.
The go-to-market strategy so far has been mostly sales-driven. There are plans to introduce self-service to lay the foundation for a product-led growth motion. But this is not in place yet.
Marketing’s role is mostly to increase leads for the sales team.
The startup has an aggressive growth goal (MRR). 80% of this goal is planned to be achieved by the proven marketing & sales-driven approach. First self-service and a freemium setup are expected in 5 months, and the plan is for this pillar to contribute 20% of the MRR in 12 months.
From Business Strategy to Data Strategy
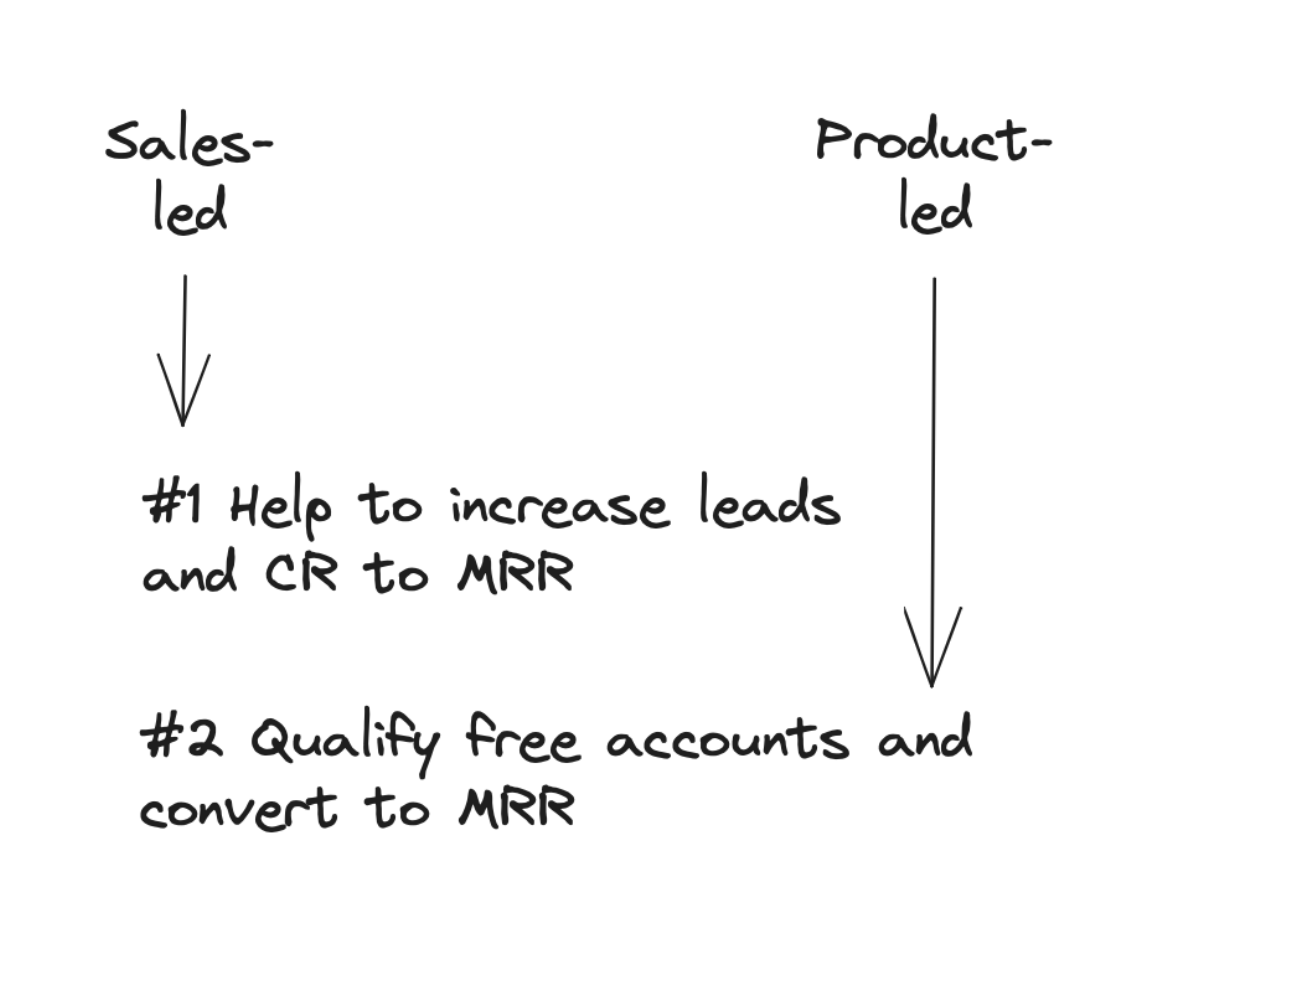
Our data strategy has one high-level focus area:
Primary: Help marketing and sales teams to increase leads and lead-to-MRR conversions
Secondary: Help the growth team to qualify free accounts and convert them to MRR
Based on the business strategy, we focus first on the current marketing and sales goals. The freemium plan is planned for five months, so we need to ensure we have a foundation in place once it launches, but anything beyond that is too early.
2.3 Deriving Data Goals from Business Goals
Inherit the Business Goals
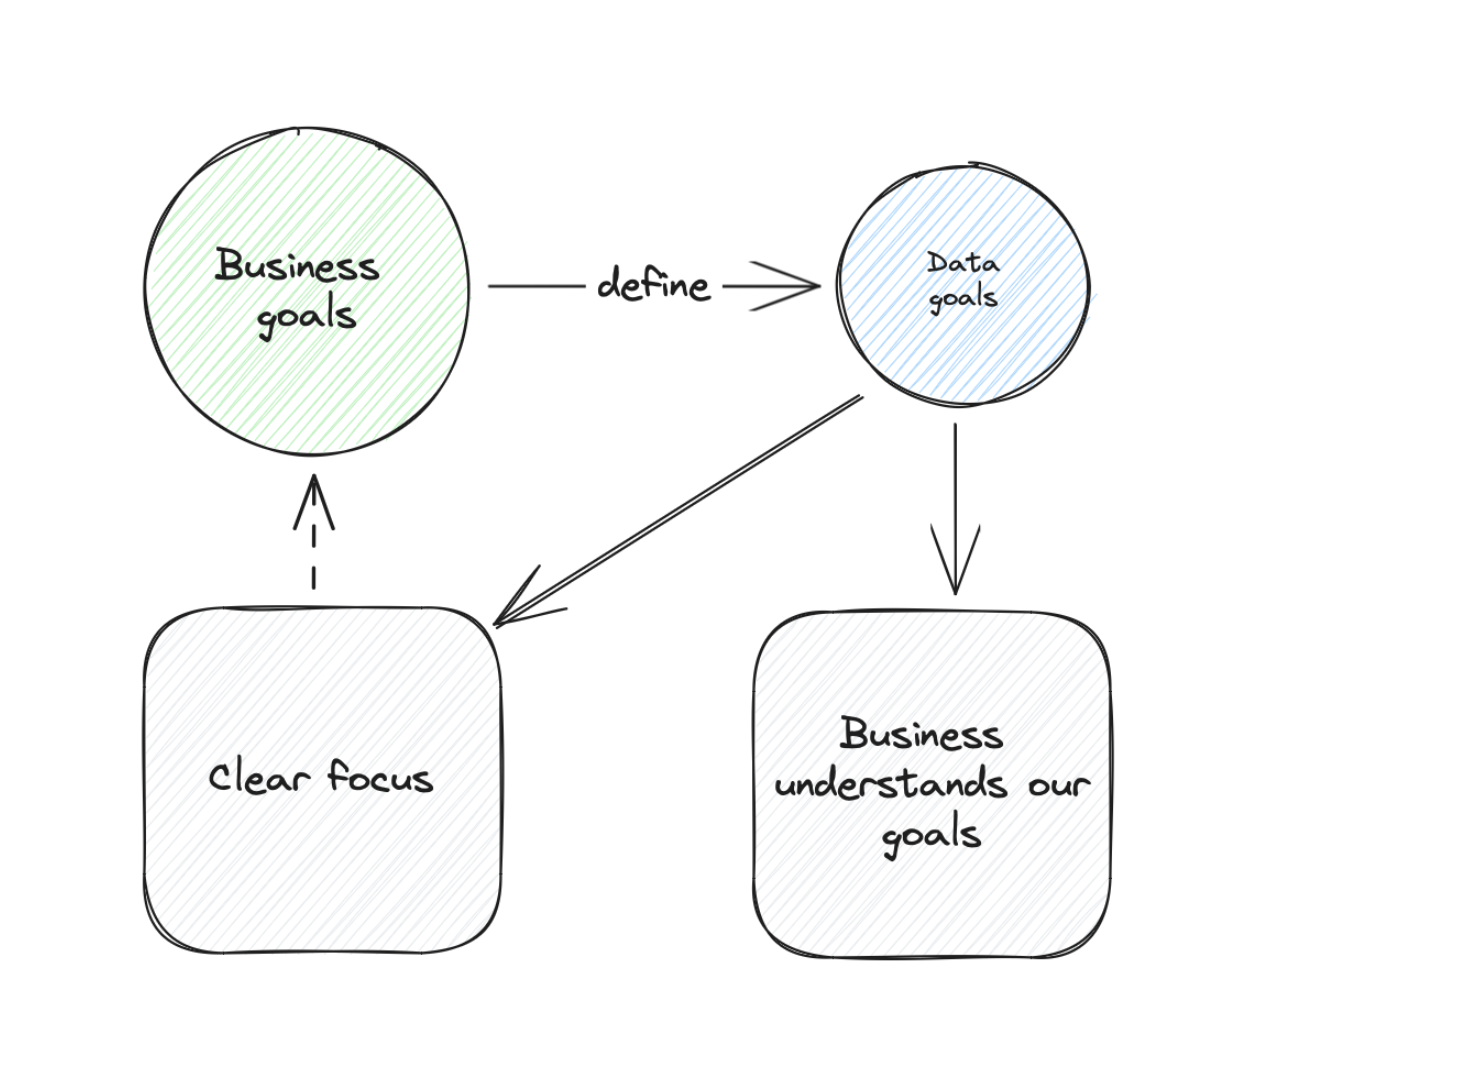
Since we want to connect to the business strategy as closely as possible, we continue beyond the strategy level and adapt our goals from the business goals.
This has two advantages:
First of all, it gives us a clear focus. We only define goals that can be connected to a business goal. If we have a goal with no connection, it is irrelevant to us right now.
Second, it makes our communication with all other business teams easy. We can show them our goals and how they are connected to their goals.
Example: From Business Goals to Data Goals
Business goals:
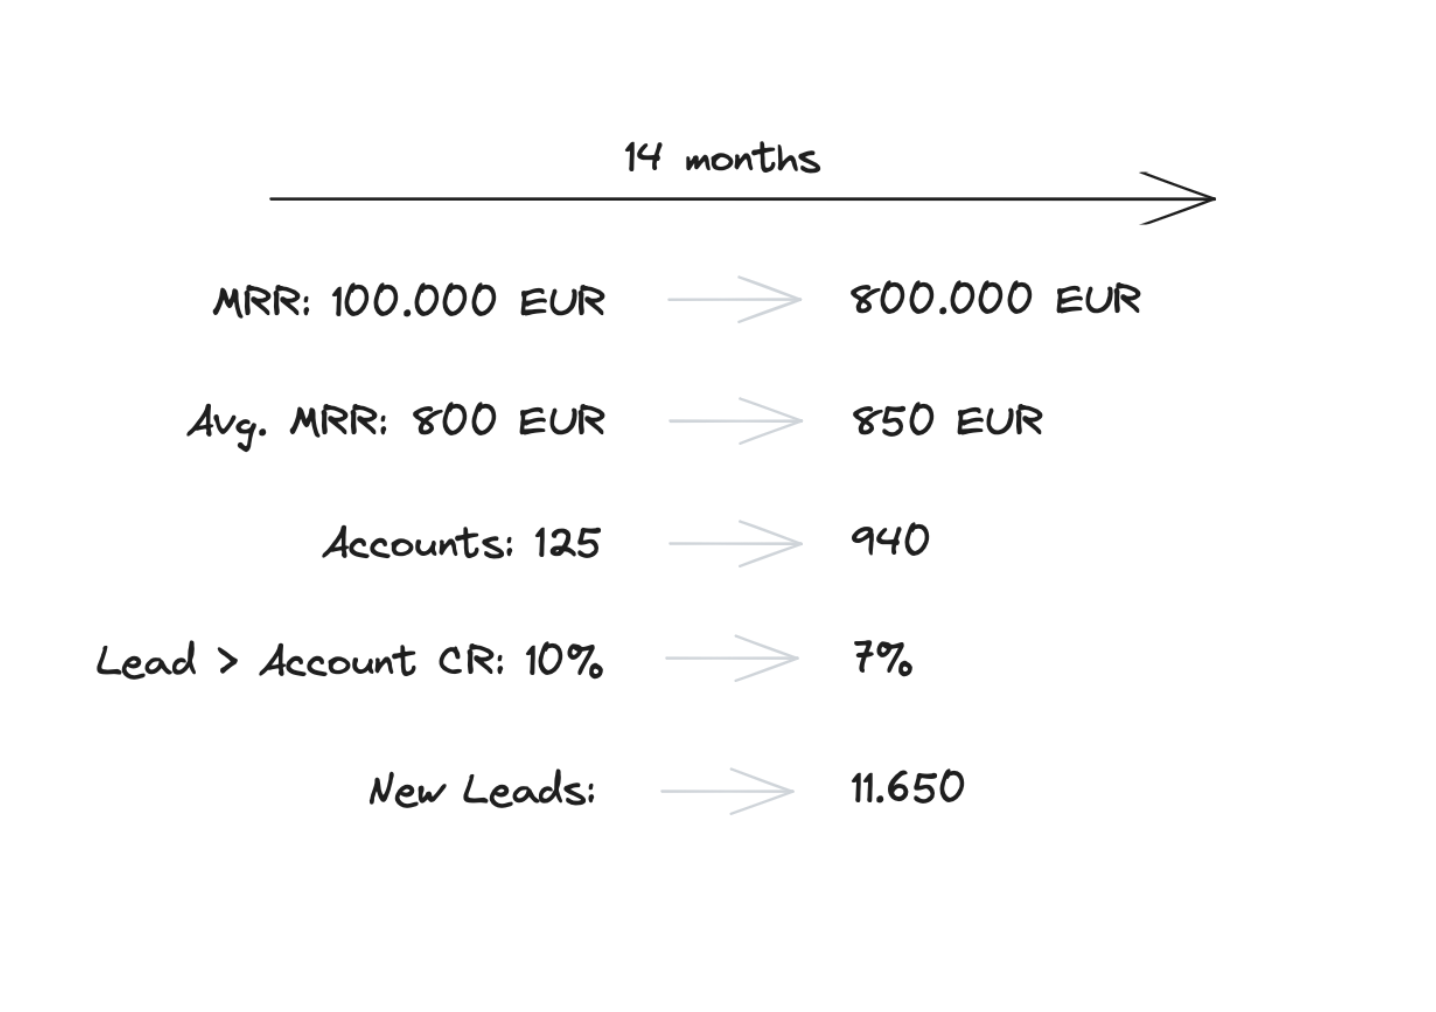
The company needs to grow the current MRR by 800% from 100k to 800k USD. The avg. MRR of one account is 800 USD. The goal is to grow the accounts but also to extend the avg. MRR to 850 USD.
This means that after 14 months, we need 940 accounts — this means 815 new accounts.
Their current lead-to-account conversion rate is 10%. We assume this to go down since Marketing will work with a broader targeting — so we plan with 7% here.
This means Marketing needs to generate 11,650 new leads. Let’s break it down to monthly metrics (linear base): 835 Leads and 60 new paying accounts.
Yes, you can surely see the stress on their faces.
Data Goals: The Leads Goal
For the leads goal (11,650 new leads):
The data team will enhance the lead data to help understand lead costs, lead quality, and lead volume to make better budget and initiative decisions.
Lead costs will be calculated based on a new model that includes direct costs (like campaigns) and indirect costs (like agencies, freelancers, and production).
Deliverables:
- An asset that will measure each initiative weekly for new leads and the cost per lead so marketing can decide on budget shifts or new initiatives
- An asset that will show dynamic lead goal performance — to give marketing a daily perspective if they are on track to achieve the goal
Initial assets in four weeks, iterations over the next 12 weeks.
Data Goals: The Sales Goal
For the sales goal (815 new accounts):
Develop a lead-scoring model that enables the sales team to prioritize leads more effectively, aiming to double the lead-to-account conversion rate from the current benchmark of 7% to a target of 15%.
Deliverables:
- Deploy the initial lead scoring model to the CRM system within four weeks from project initiation
- Begin iterative improvements over the subsequent 12 weeks, with bi-weekly reviews to assess model performance and incorporate feedback from the sales team
- Establish key performance indicators (KPIs) to monitor the model’s impact on lead prioritization and conversion rates, adjusting the model as needed to meet the strategic goal
Breaking Down Goals into Initiatives
A goal is a great start, but we want to deliver something in the end. In our goals, we already defined a timeframe. To deliver in this timeframe, we need to plan our next steps.
I use one or multiple initiatives to organize the work depending on the goal and team. I tend not to use more than two initiatives, but this depends on the team. When we have a bigger team, you can cover more initiatives.
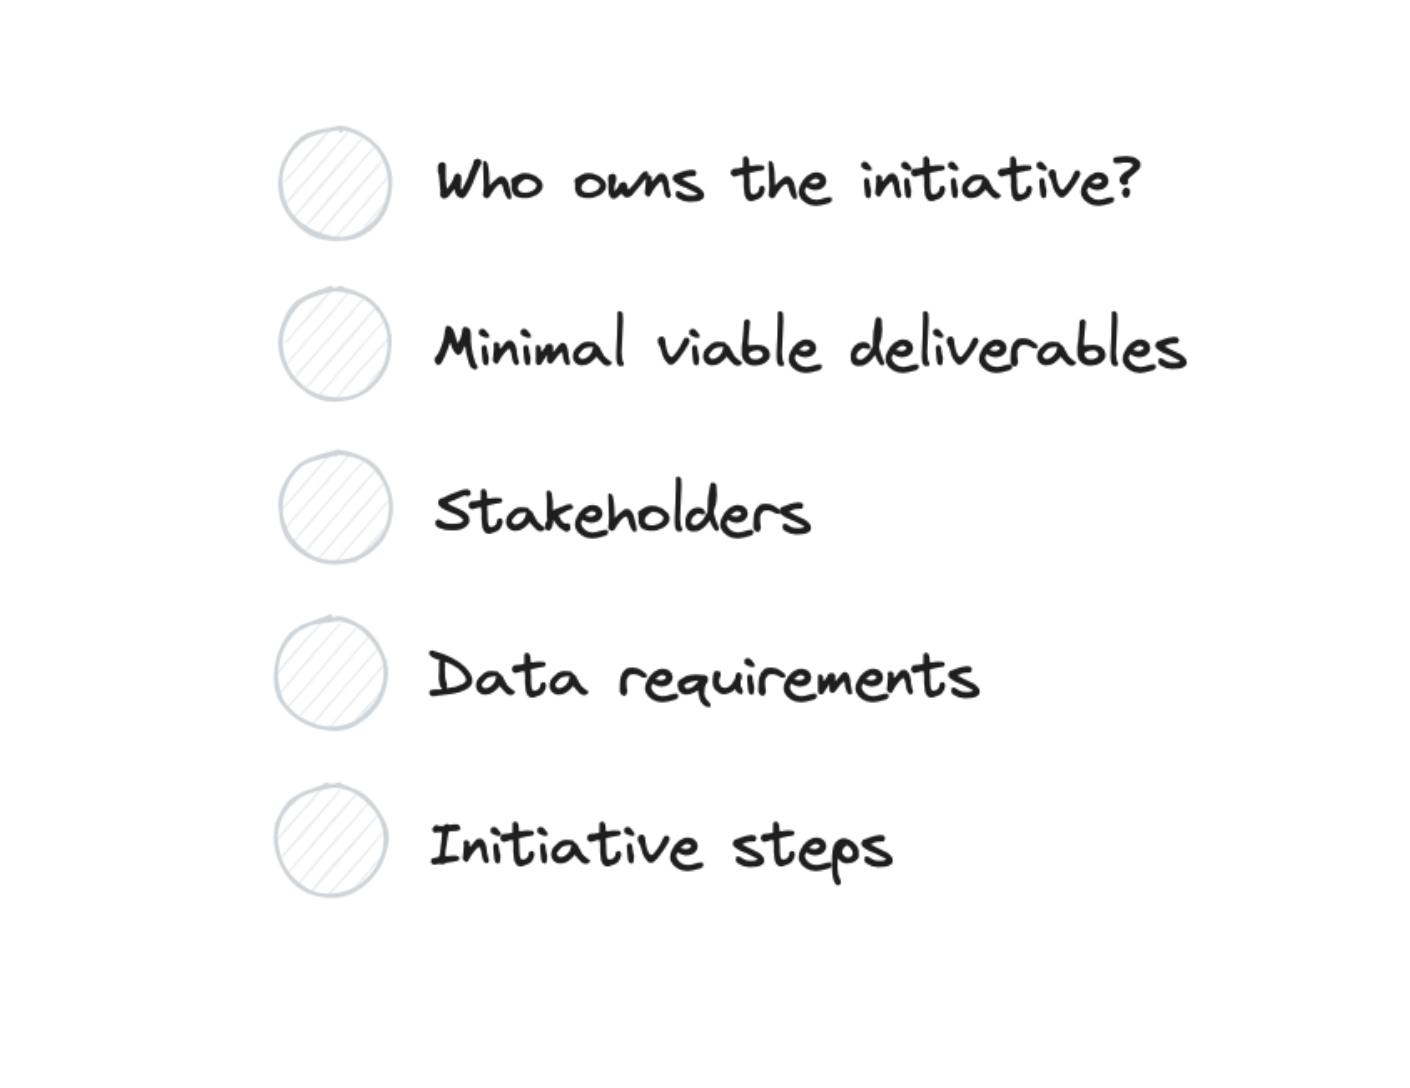
An initiative translates a goal into operational steps:
- Who owns the initiative
- What are the minimal required deliverables
- What are the stakeholders we work with
- What are our data requirements
- What are the logical steps we plan for this initiative
Example Initiative
Initiative 1: Provide the initiative performance report
Owner: Sara
Minimal viable deliverables:
- Spreadsheet or Data Table, which is sortable and filterable
- Dimensions: campaign, initiative
- Metrics: users, new leads, lead conversion rate, lead costs (direct), lead costs (calculated)
Stakeholders: Tim (Head of Growth)
Data requirements:
- Events: Leads created
- Campaigns: based on UTM-Parameters
- Initiatives: we need a mapping from the campaign, referrer to the initiative
- Cost: Direct costs need to be imported
- Calculated costs: We need a mapping for all other costs to initiative [Risk: This can become a black hole of complexities]
Initiative steps:
- Align on minimal required deliverables
- Initiate missing data collection
- Build a report with existing data
- First user test
- Extend the reports with new data
- Final user tests
Final Thoughts on Data Strategy
What I have added here won’t appear in any data strategy book, which is fine. I think there are different data strategy approaches, and I hope for a good book in the future to cover these. The approach described here worked for me in different setups.
🎯 Key Takeaways
Two takeaways on data strategy:
-
Insist on having a data strategy — even if it is a one-pager where you lay out your idea of a data strategy and get your stakeholder’s comments and approval. This will help you get buy-in and support when needed (for example, to get development resources).
-
Only things connected to business strategy and goals are valid for you. Suppose you have the goal to add a new data catalog and can’t map it to a business goal (and please be honest here with yourself). Then, it is not worth doing it. You want to be accountable. This is the best way to do it.
2.4 Measuring Your Setup
Why Do We Need to Measure Our Setup?
I have two traits that can make work a bit hard: I optimize for comfort and am good at forgetting things. Luckily this forced me to devise ways to ensure that I comfortably ensure that things are in good shape.
When I have ownership of a setup, I need to create a guardrails system that regularly checks the state of the setup and tells me what I need to work on.
This is what we create in this step. Is it a requirement before you build an event data setup? No, but I recommend setting it up in a lean initial version. Trust me, it will save you time and, more importantly, gives you confidence in the data setup.
Combining Qualitative and Quantitative Data
Defining these guardrails and metrics is not straightforward since we can’t simply create event data about event data (actually, we can, more on this in a second). This is why we combine qualitative and quantitative data to measure the state of our setup.
Did you say qualitative data? So do I have to talk to other people? Yes, and this will be one of the best things to happen to your setup.
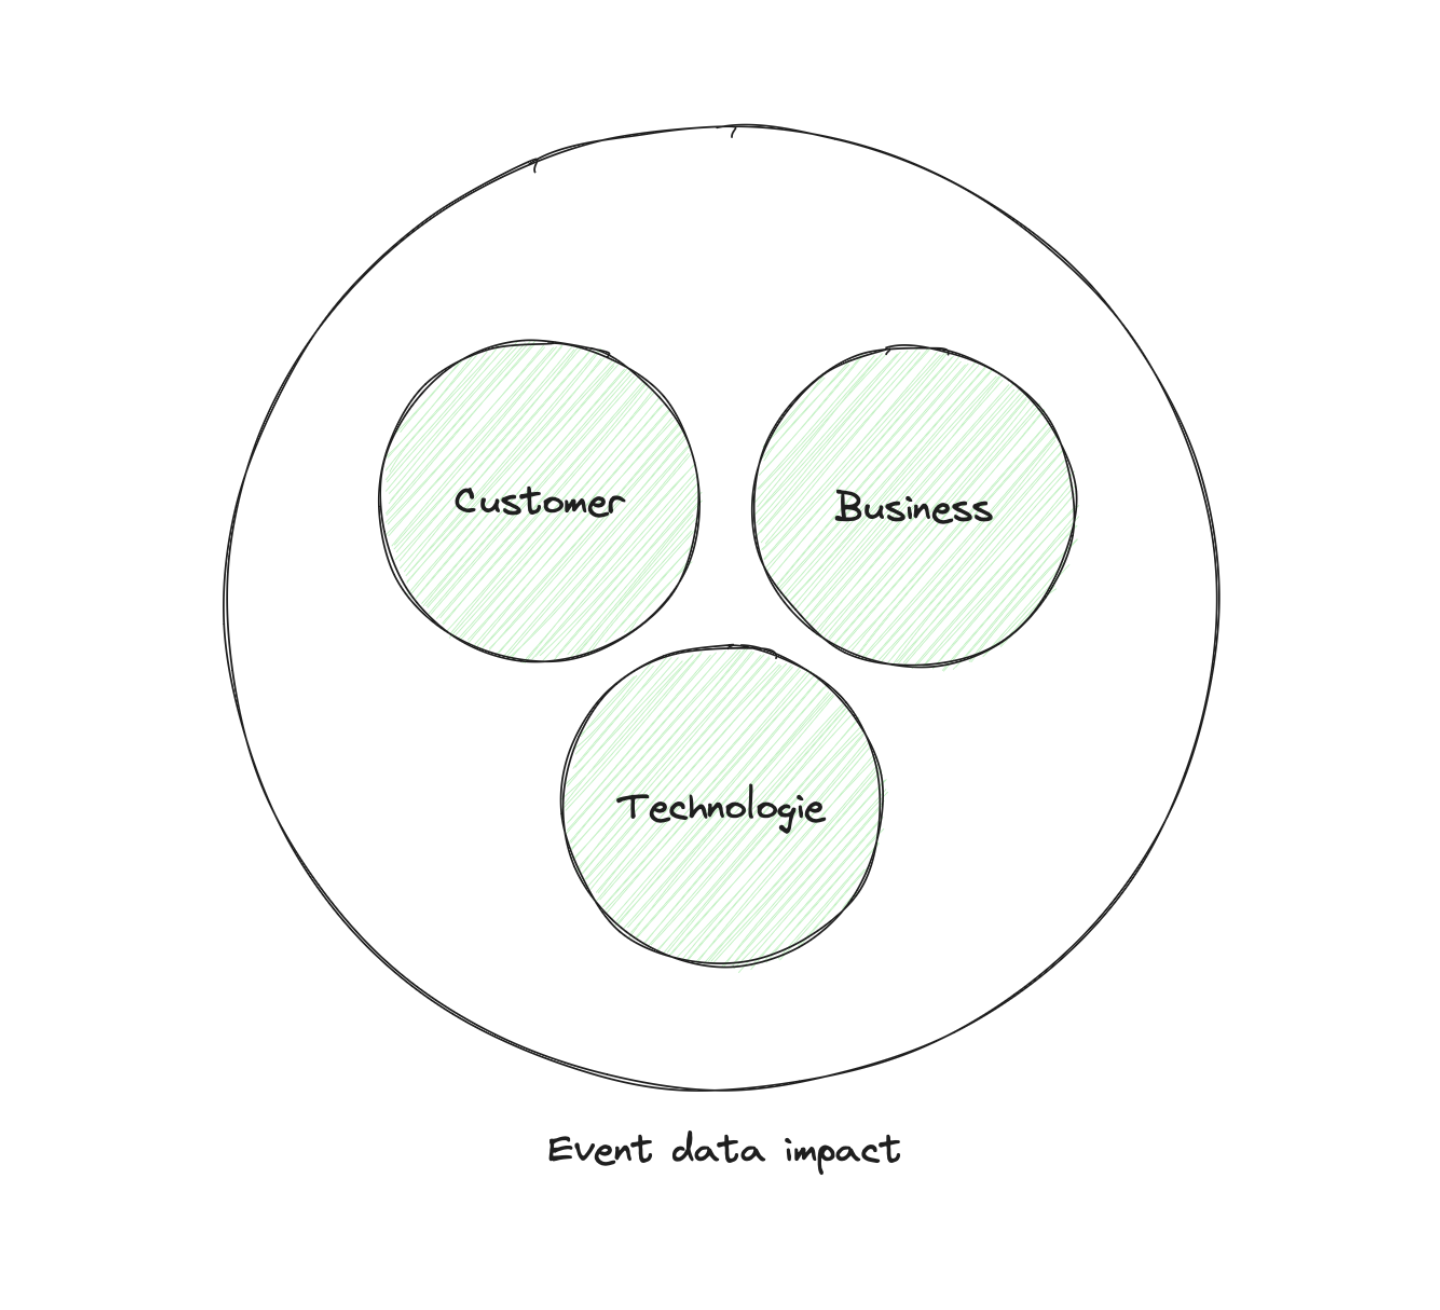
To define our event data guardrails setup, we will divide it into three dimensions:
Looks into the value that the setup is bringing to a single person in their daily work.
Goes one level up and looks into the value that the setup is bringing to your business (yes, that will be the hard one).
Mostly based on quantitative facts and metrics around your implementation and your ability to execute on evolution (usually the easiest to start here).
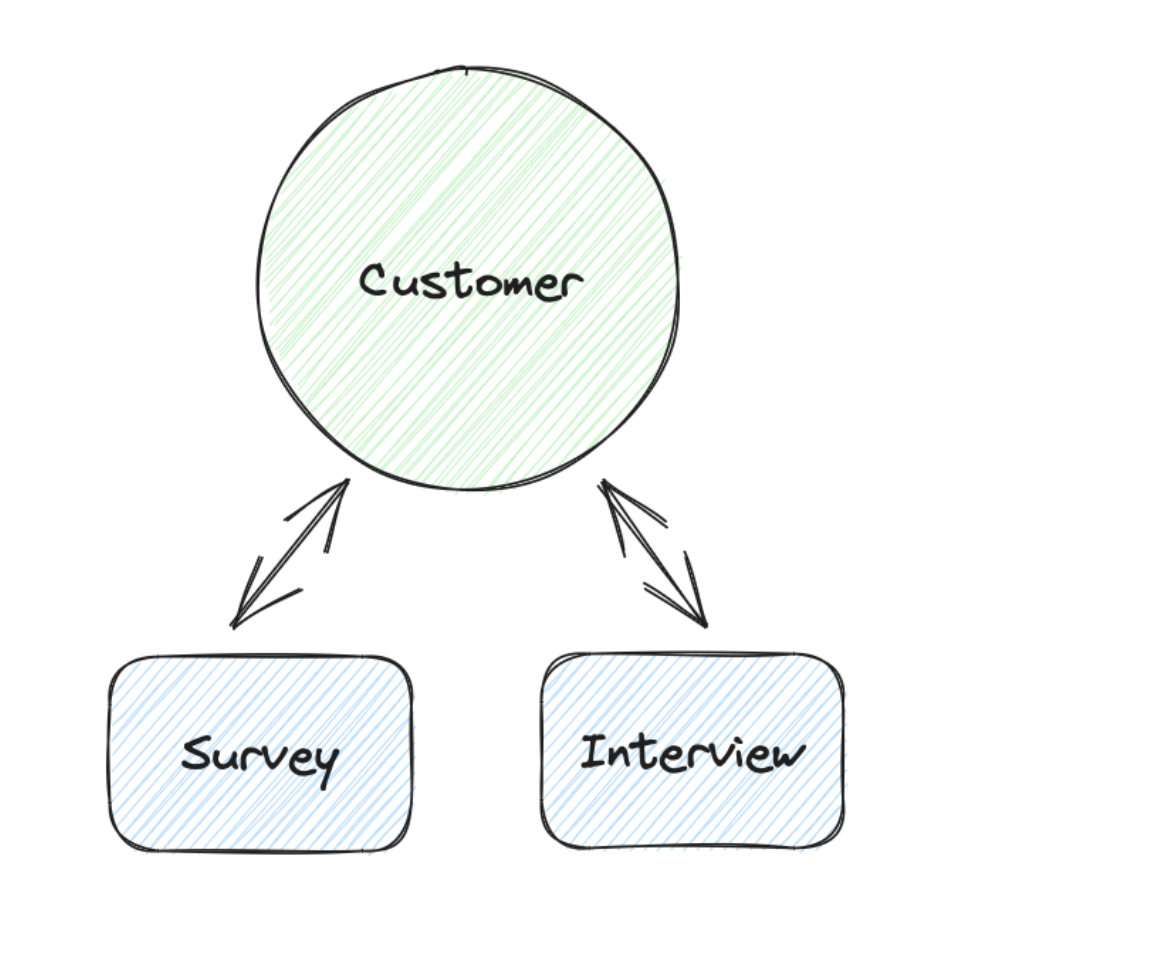
The Customer Dimension
Our customers are all people in our company who work with event data. This work can be like product analysts understanding the retention rates of different cohorts. Or indirectly, like sales teams who make prioritizations based on a scoring model based on event data.
They are our first focus since we can talk with them. And when they are happy, we can at least be sure that we created a foundation for generating business value.
We will use mostly qualitative data in this dimension, and I recommend using interviews and surveys to gather these.
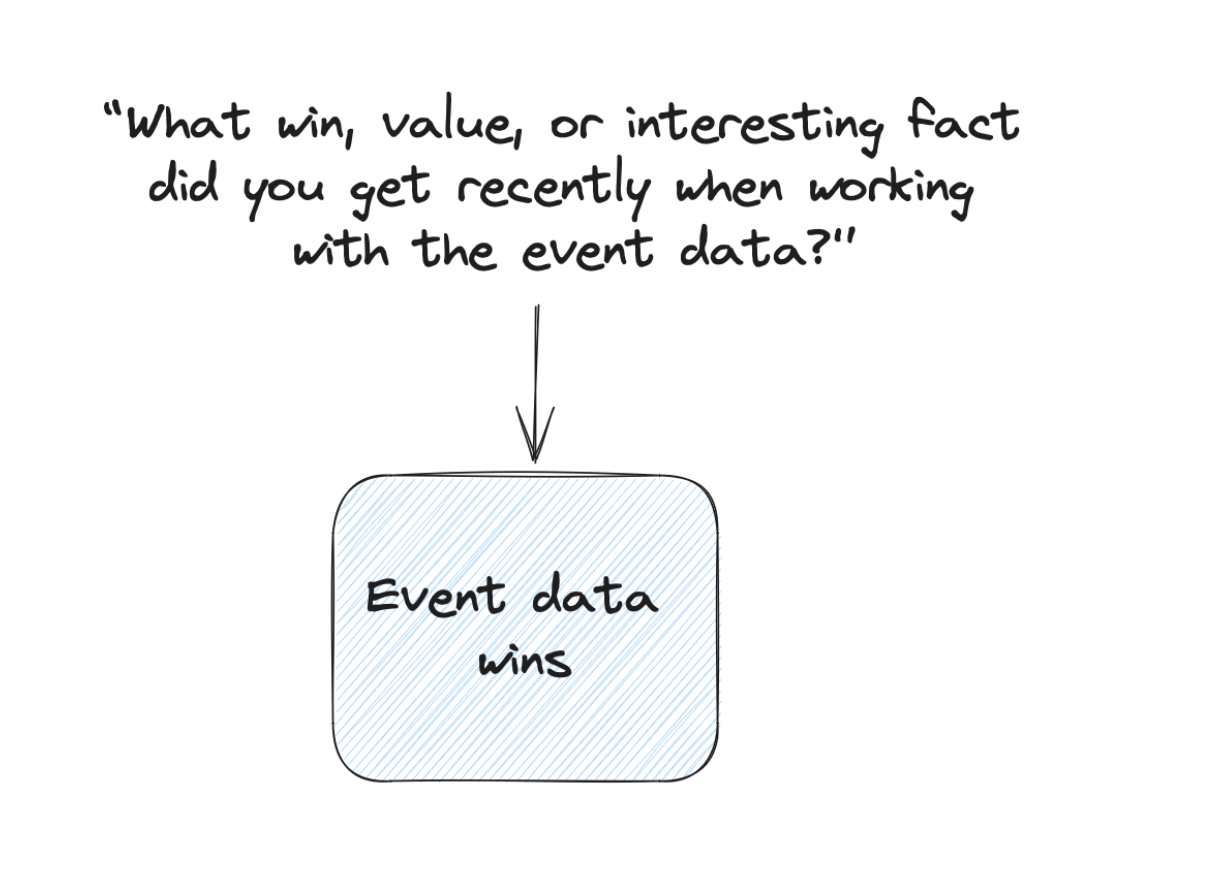
Customer Insights: Wins
You will not get these often, but they are your secret treasure chest that keeps you going; but also can help to communicate the value of the setup and can be motivational case studies for other people to work more with event data.
Ask: “What win, value, or interesting fact did you get recently when working with the event data?” And as a follow-up: “What impact had this insight had on your work and the business in general?” And to make an answer to the second question more secure: “Can I use your quote about this win?”
Make it comfortable that people can share that they did not get any value from the data recently (this is fine).
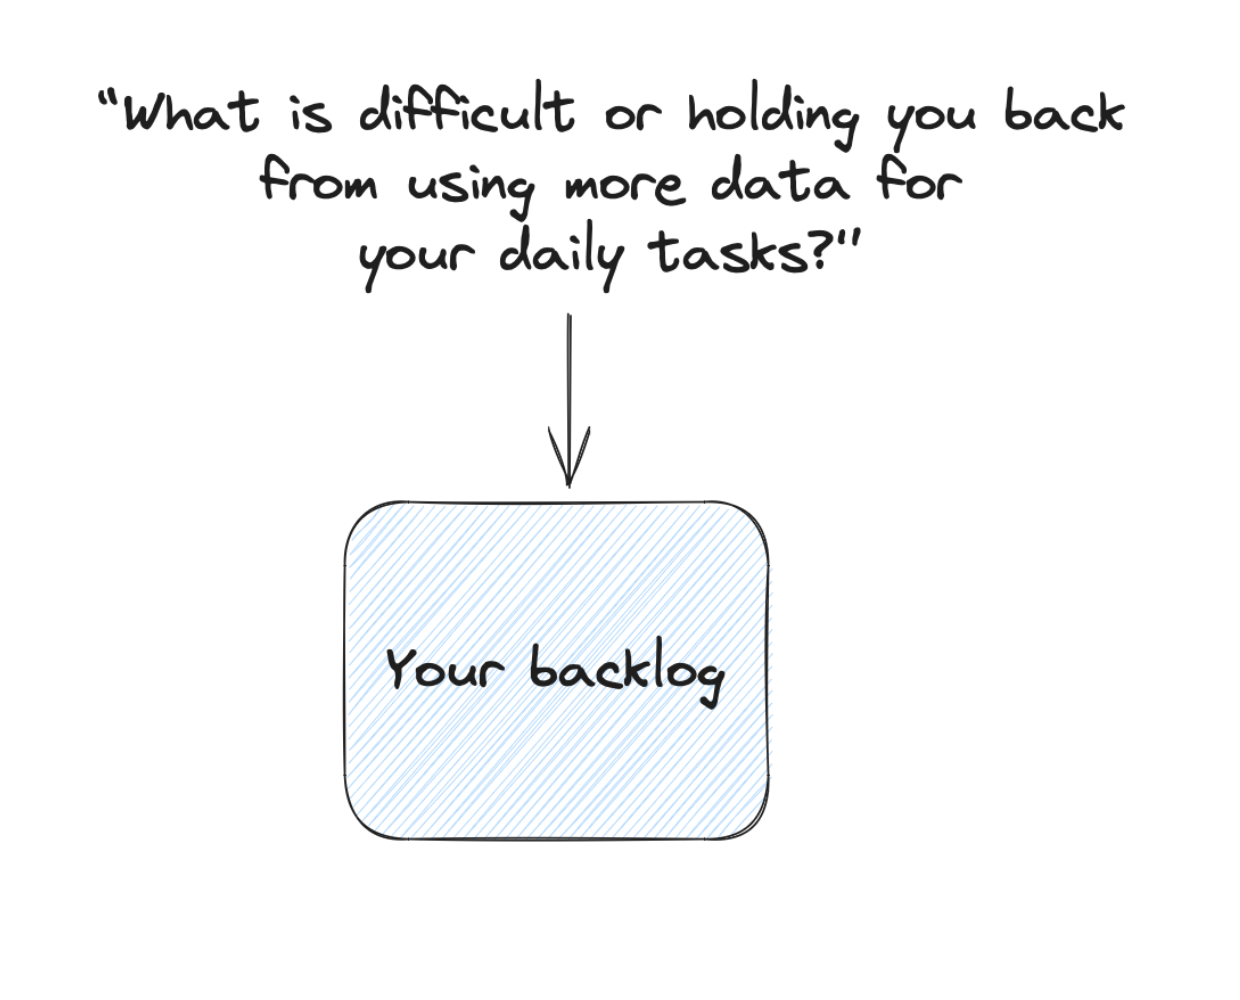
Customer Insights: Blockers
What holds them back, takes too much time, and makes them insecure about the data?
This part helps you to improve your customer experience and learn where the setup has issues.
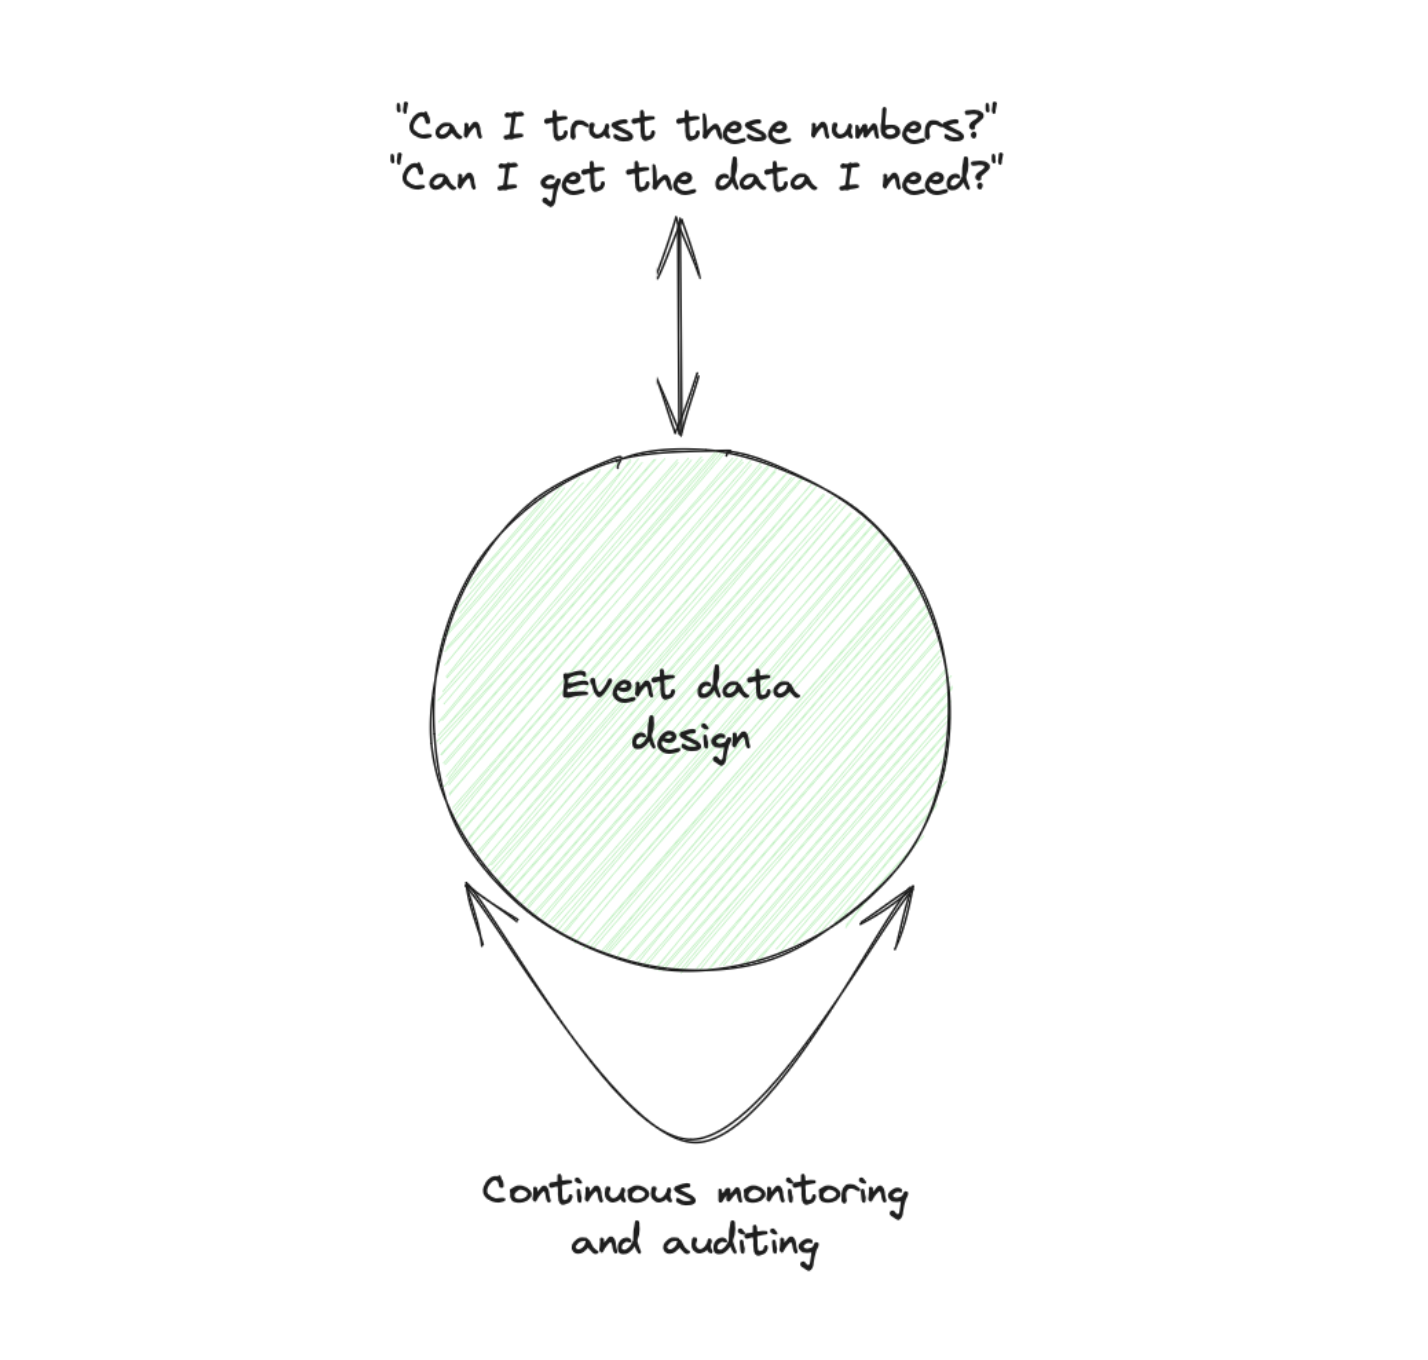
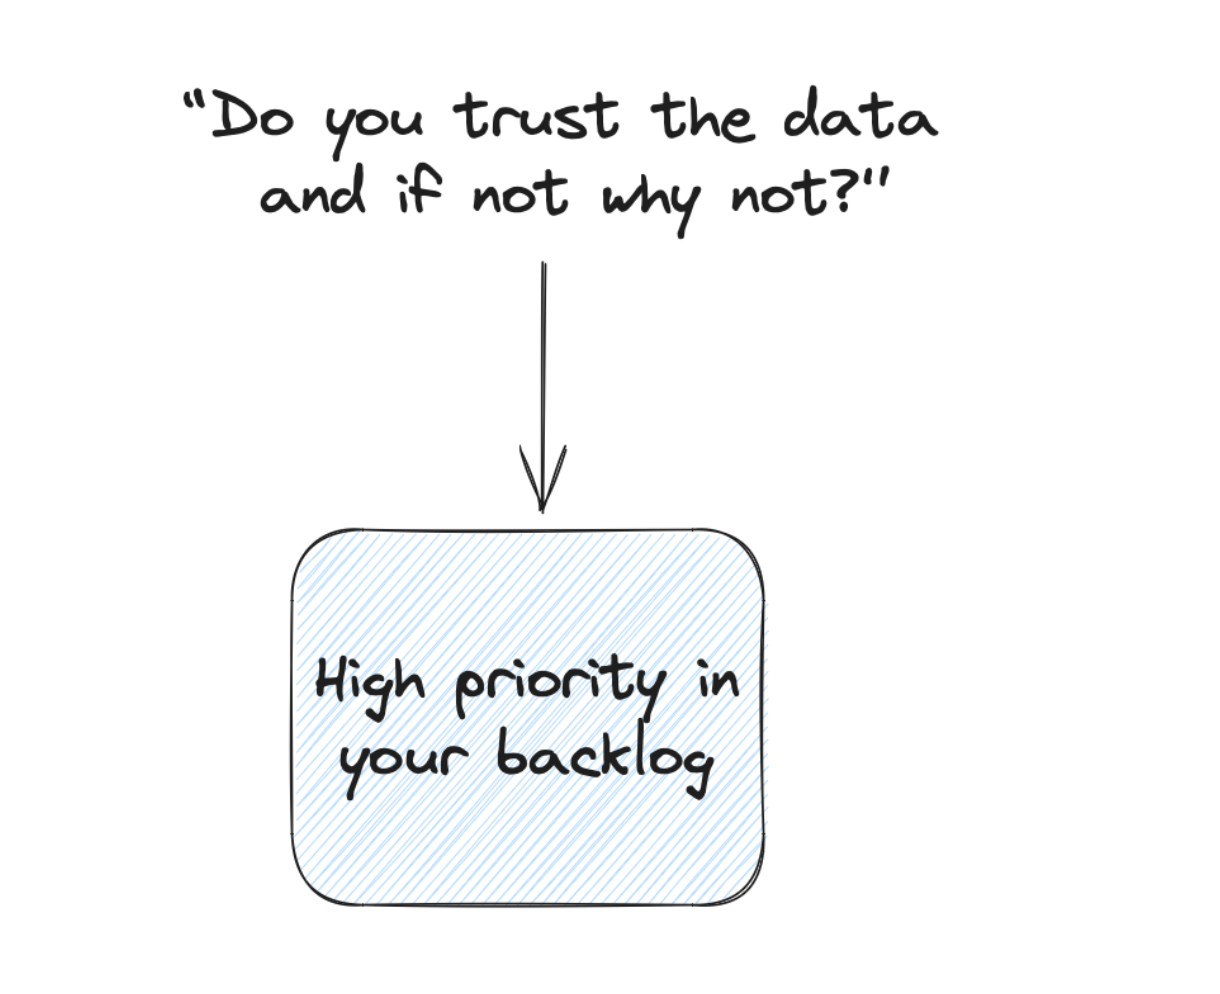
Customer Insights: Trust
Do you have data trust issues, and if yes, where are they, and in which form (a general mistrust or specific problems)?
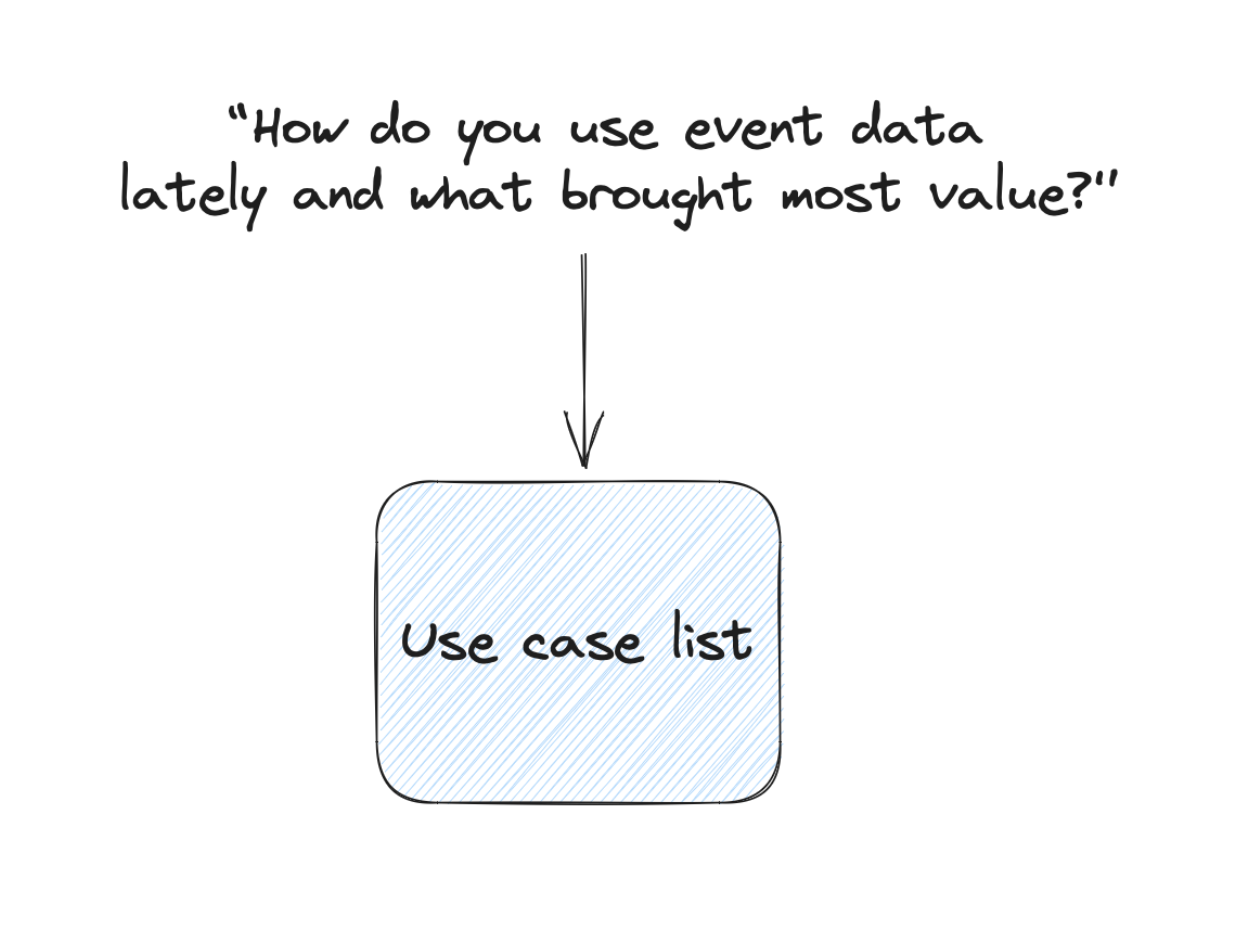
Customer Insights: Use Cases
You want to understand how they work with the event data:
- What are common and repetitive use cases?
- What was the last longer session about?
All this helps you develop new ideas on how to help with the event data setup — either by applying use cases from one team to another or by extending existing ones.
Customer Metrics
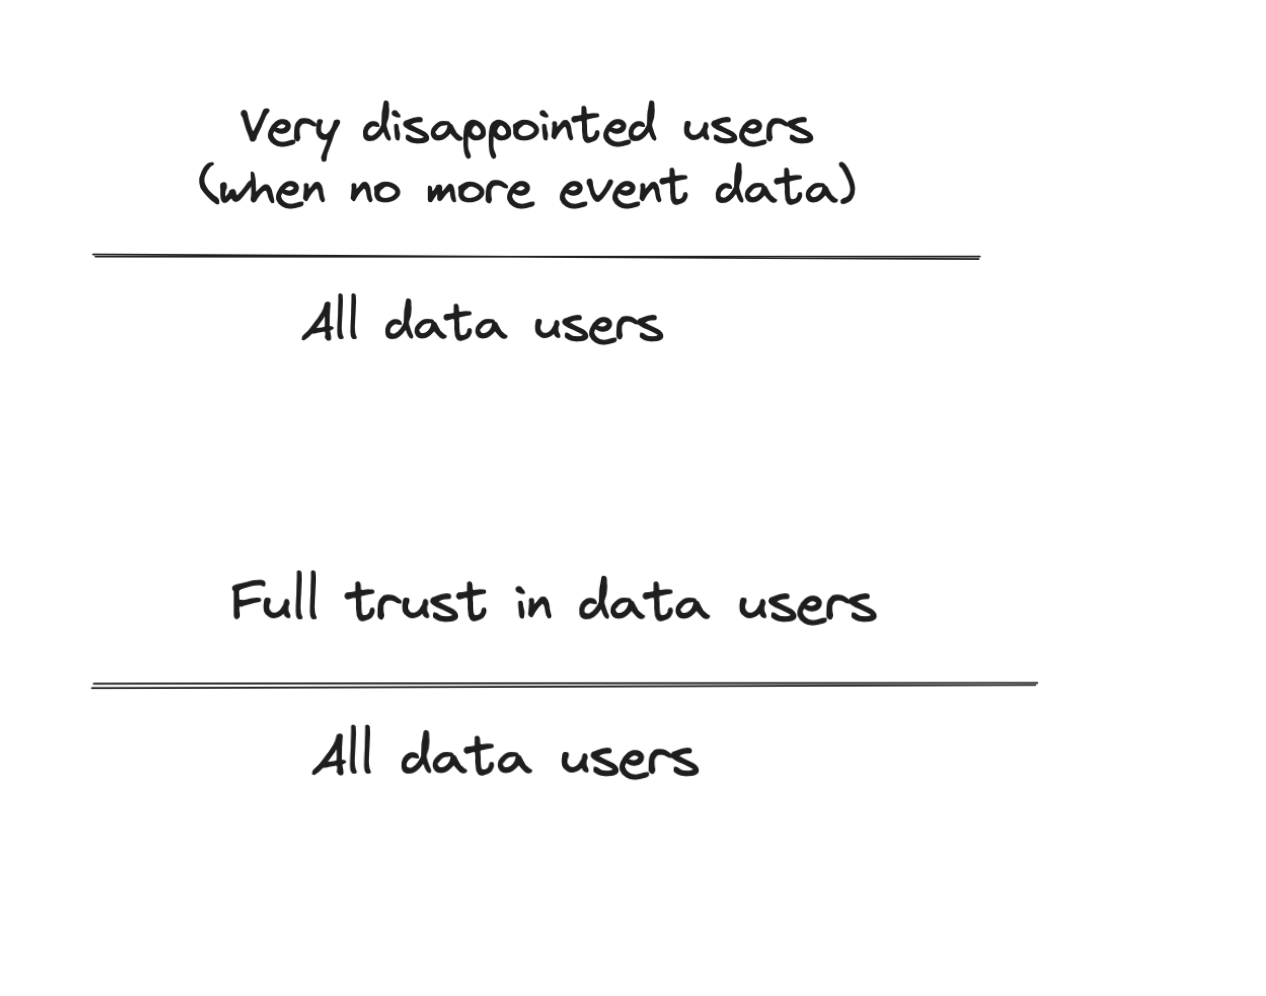
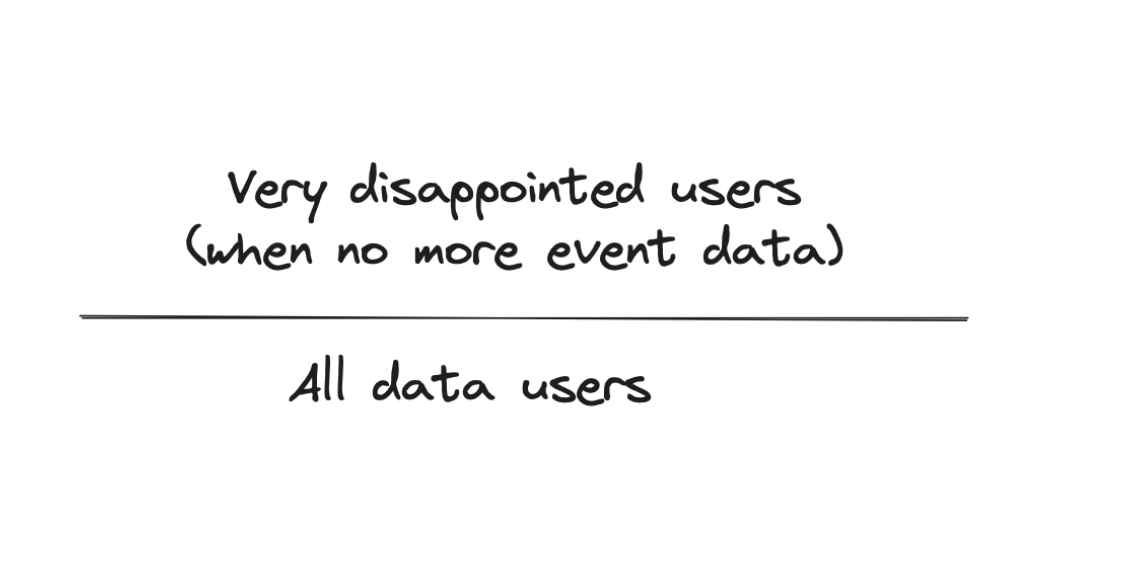
Avg. very disappointed / all data users: See the part where we ask for it in the survey. This rate is your product market fit metric. It is a good indicator to see if the relevance of the setup is increasing over time.
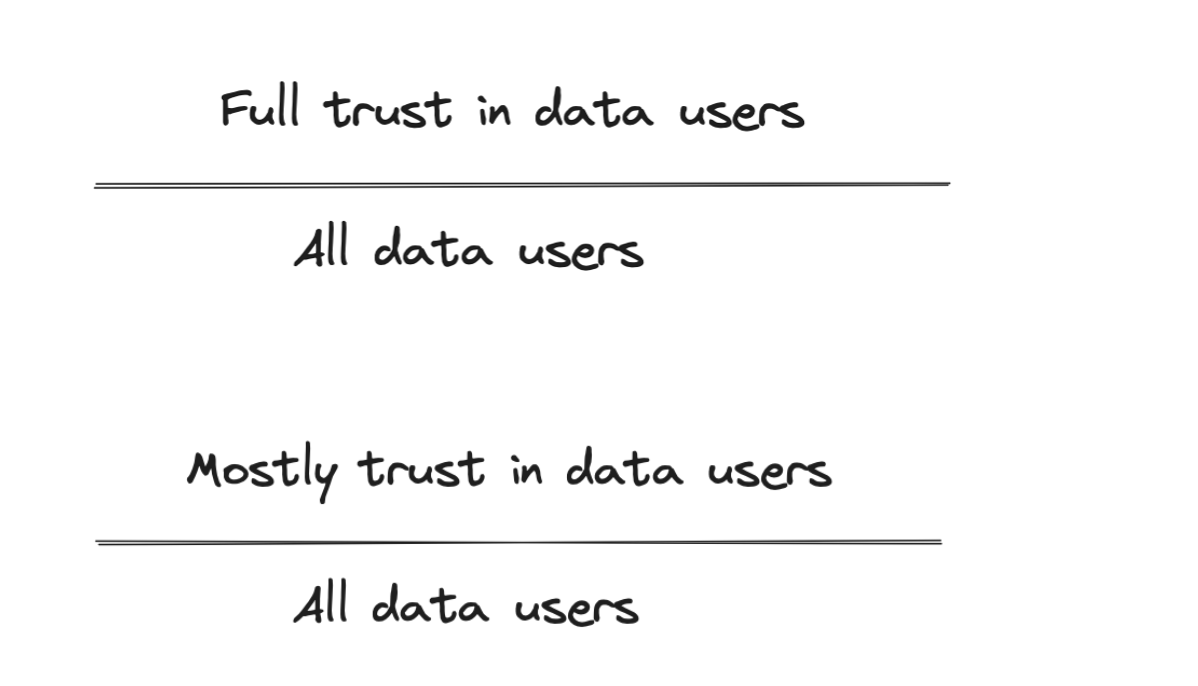
Avg. full trust / data users and mostly trust / data users: Both ratios indicate if you have an underlying trust problem. Usually, this one must be resolved before you work on other things in the setup. It is also a good alert when data trust is decreasing over time.
The Business Dimension
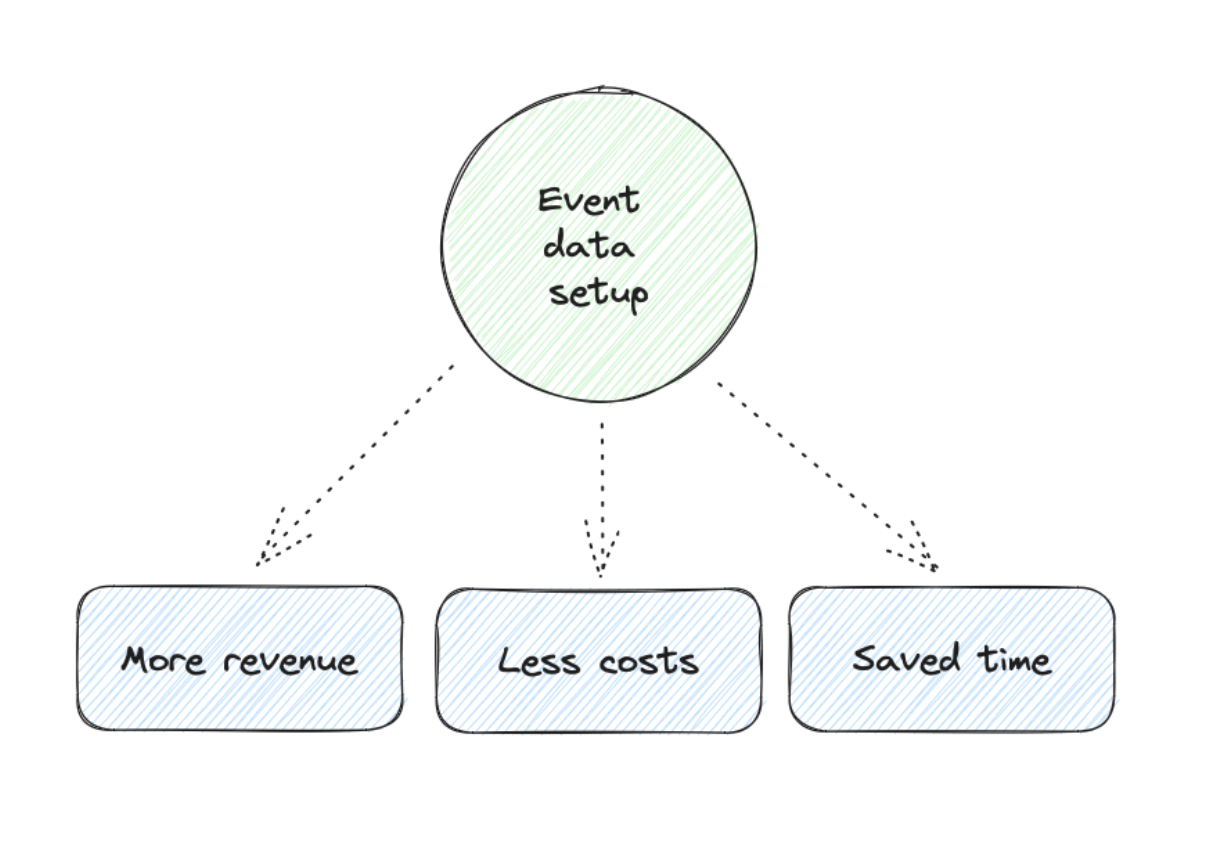
Measuring the business impact of event data would be awesome. Then, you can create these nice slides that show that our setup is generating X revenue, saving X costs, or at least saving X hours of time. This is good for getting more resources and funding and also great for your CV.
Unfortunately, attributing revenue gains and cost or time savings directly to an event data setup is often difficult. It depends on how the data is used in your company. This is the reason why the interviews in the customer dimension are so important. They can help you discover where your data setup makes a real impact.
Revenue Impact
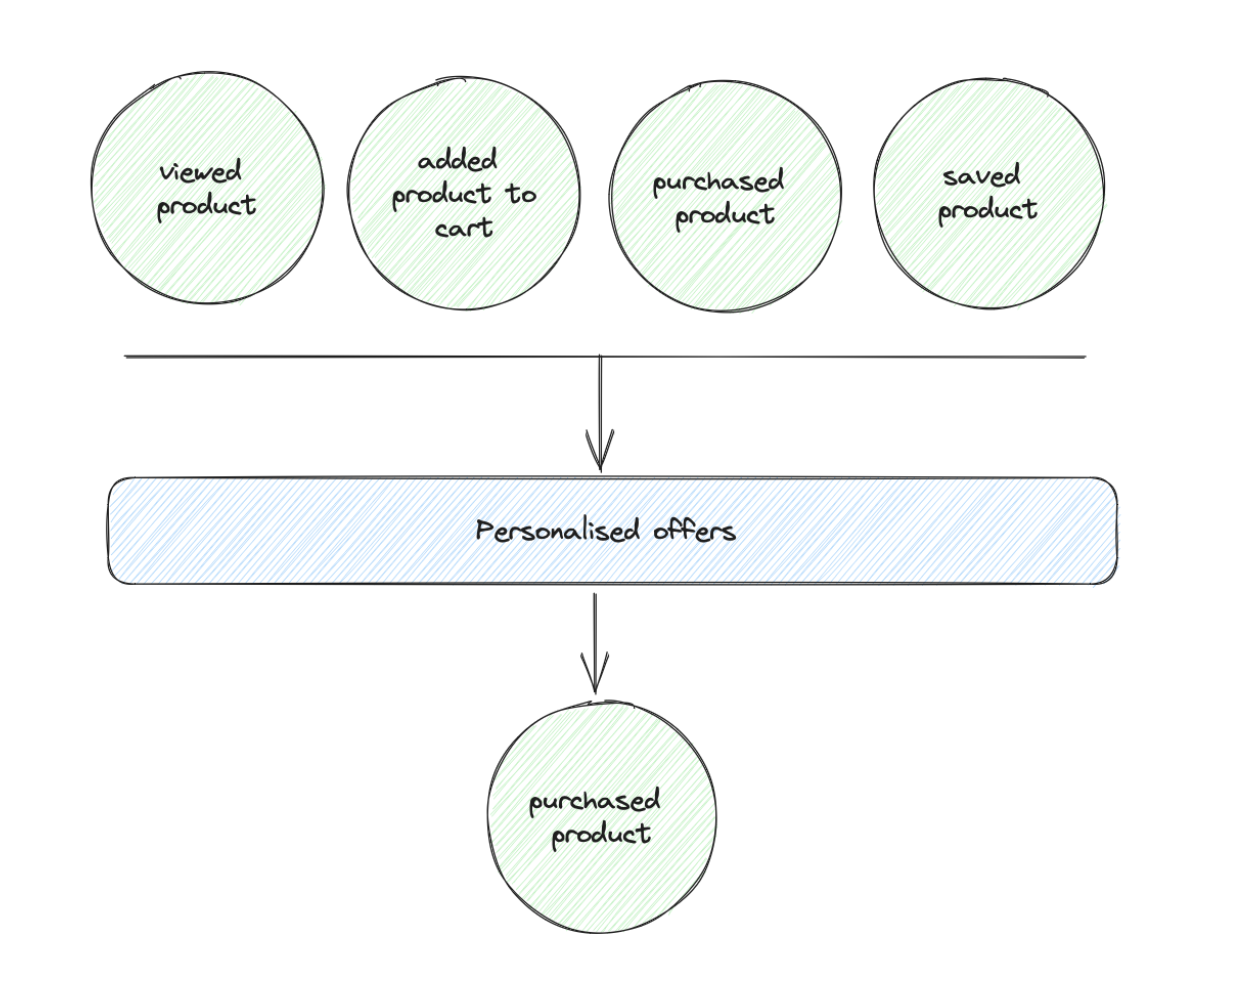
Personalization & recommendation engine: These engines are often built based on event data combined with customer data. The simplest implementation is a “products you watched carousel,” but you can also have “other customers that viewed this product, viewed that” (the Amazon example) or even totally anonymous recommendations just based on user interactions. For all these elements, you can add a simple attribution model like linear attribution to get a revenue impact of these features.
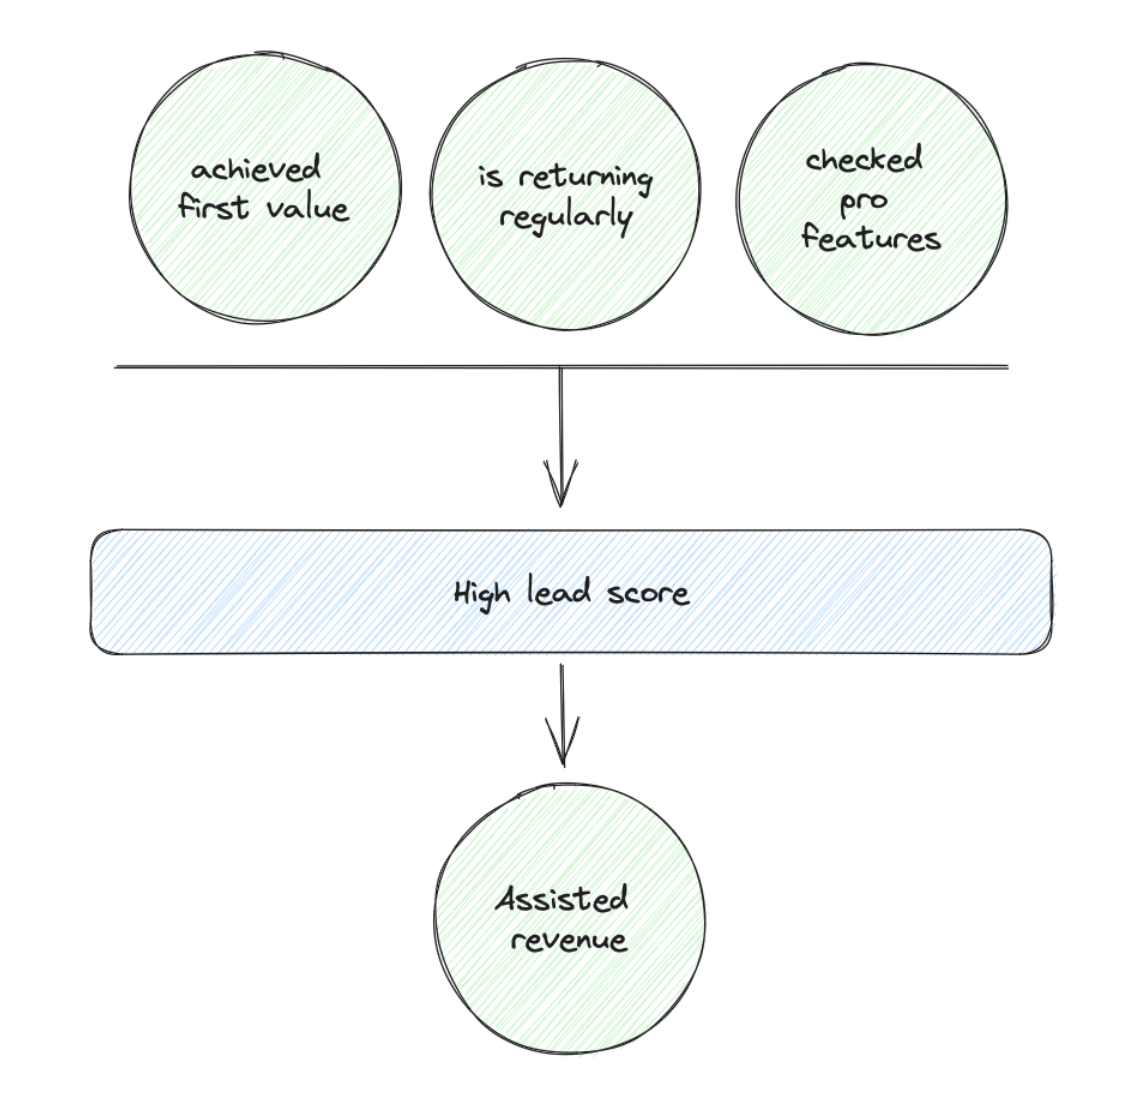
Upselling potentials: A combination of events of accounts or users can be a very good signal for upselling or conversion potentials. With this data, you can score and flag accounts with high opportunities for sales to reach out to them. I worked on several projects where we increased the close rates significantly and without much work by using account events.
You need to flag opportunities that are scored with event data and can use this flag later to get a revenue impact number. Of course, event data does not own this revenue, but you can call it assisted conversion or revenue.
Cost Impact
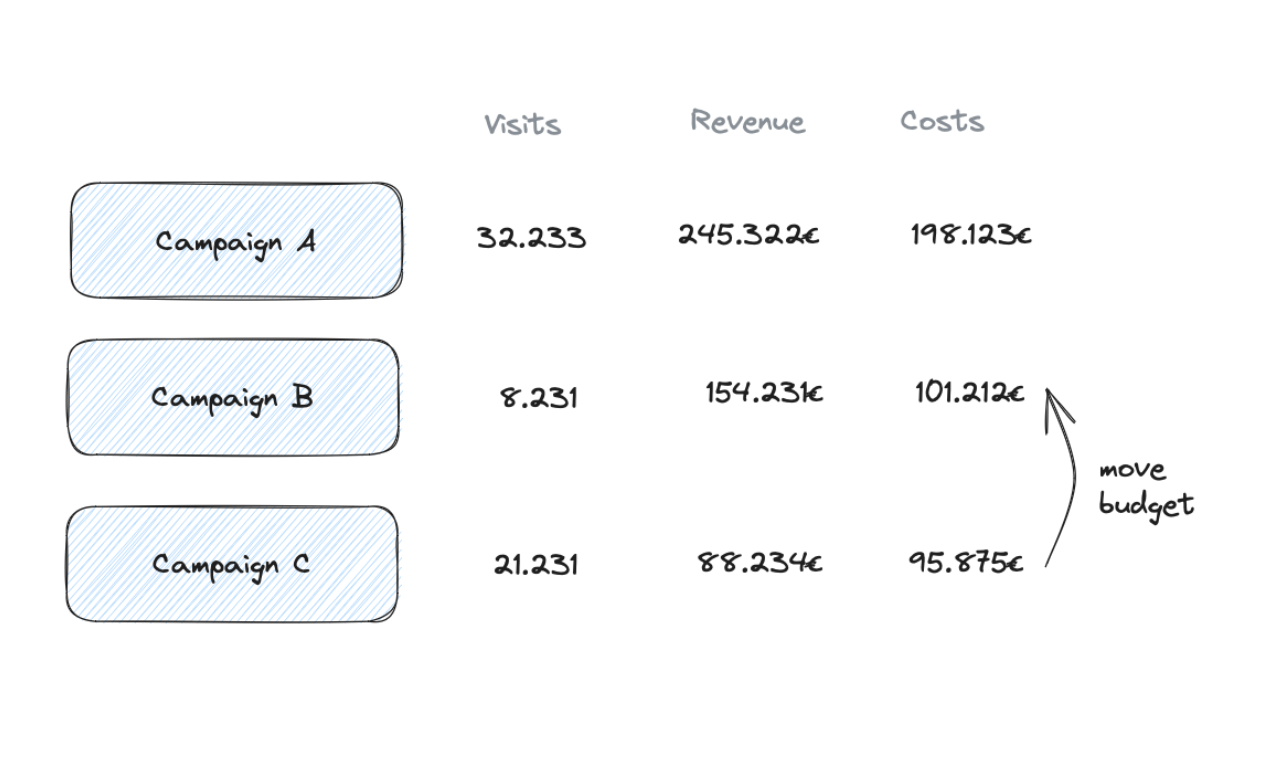
Unprofitable campaigns in Marketing: The classic example. Event data helps to create a simple customer lifetime funnel (or sometimes just a session funnel). You can compare and analyze campaign performance in the funnel to identify the campaigns underperforming. This can lead to budget shifts or a reconfiguration of the campaigns to be more effective.
This one can generate straightforward value but often is hard to estimate. Ultimately, you shift budgets and do not reduce costs at all. Therefore, you can’t use saved campaign costs as an indicator. You can use the Customer Acquisition Costs or Cost-Revenue Ratio as indicators if marketing campaigns become more effective. But this includes plenty of factors and not only funnel performance.
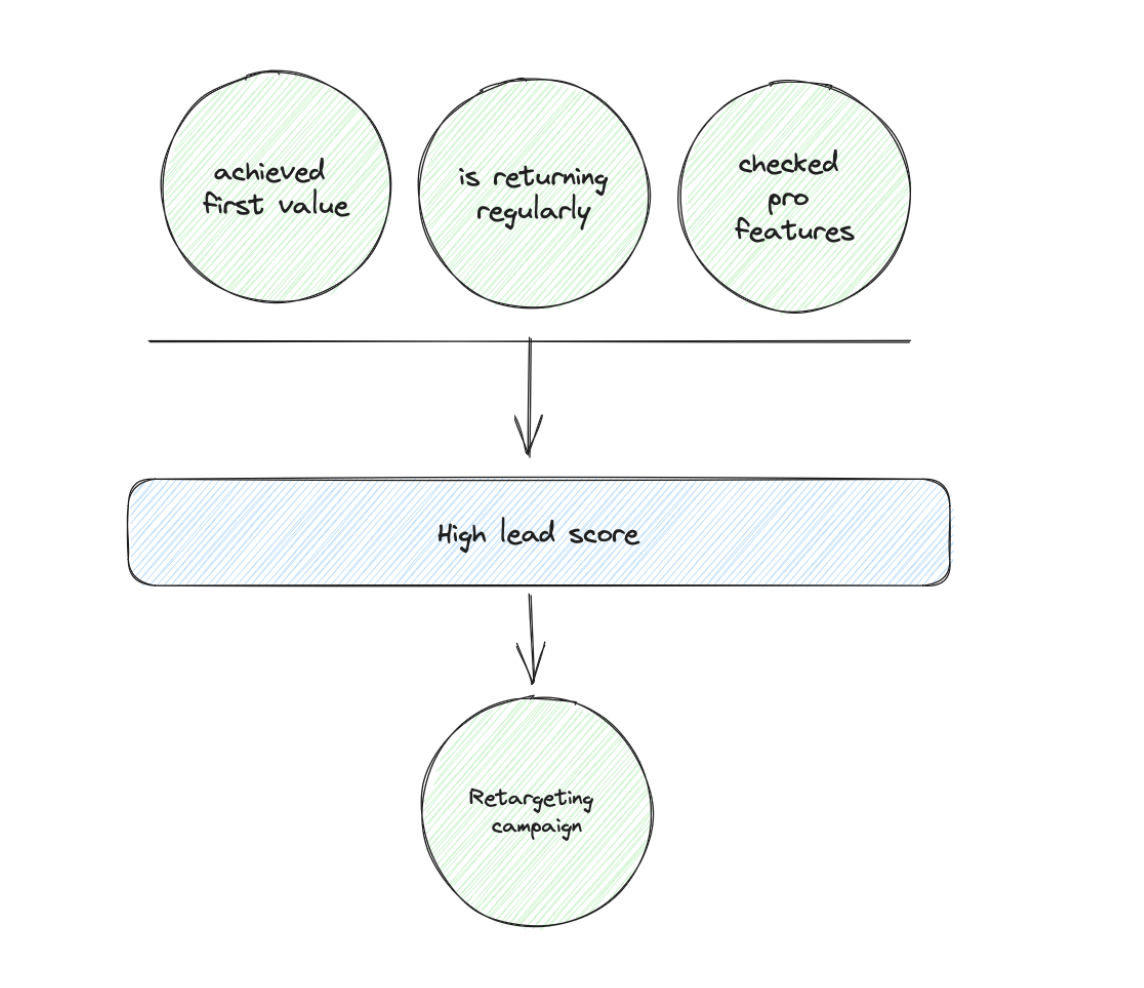
Better retargeting or outreach: Similar to the lead scoring in the revenue part, you can use the same mechanism to build better audiences for retargeting or exclude leads from further activities. This can save money since you improve the audience for retargeting.
Time Impact
Time savings are easier to attribute than costs, and I like this outcome since saved time can be reused to unlock greater stuff. Real productivity improvement.
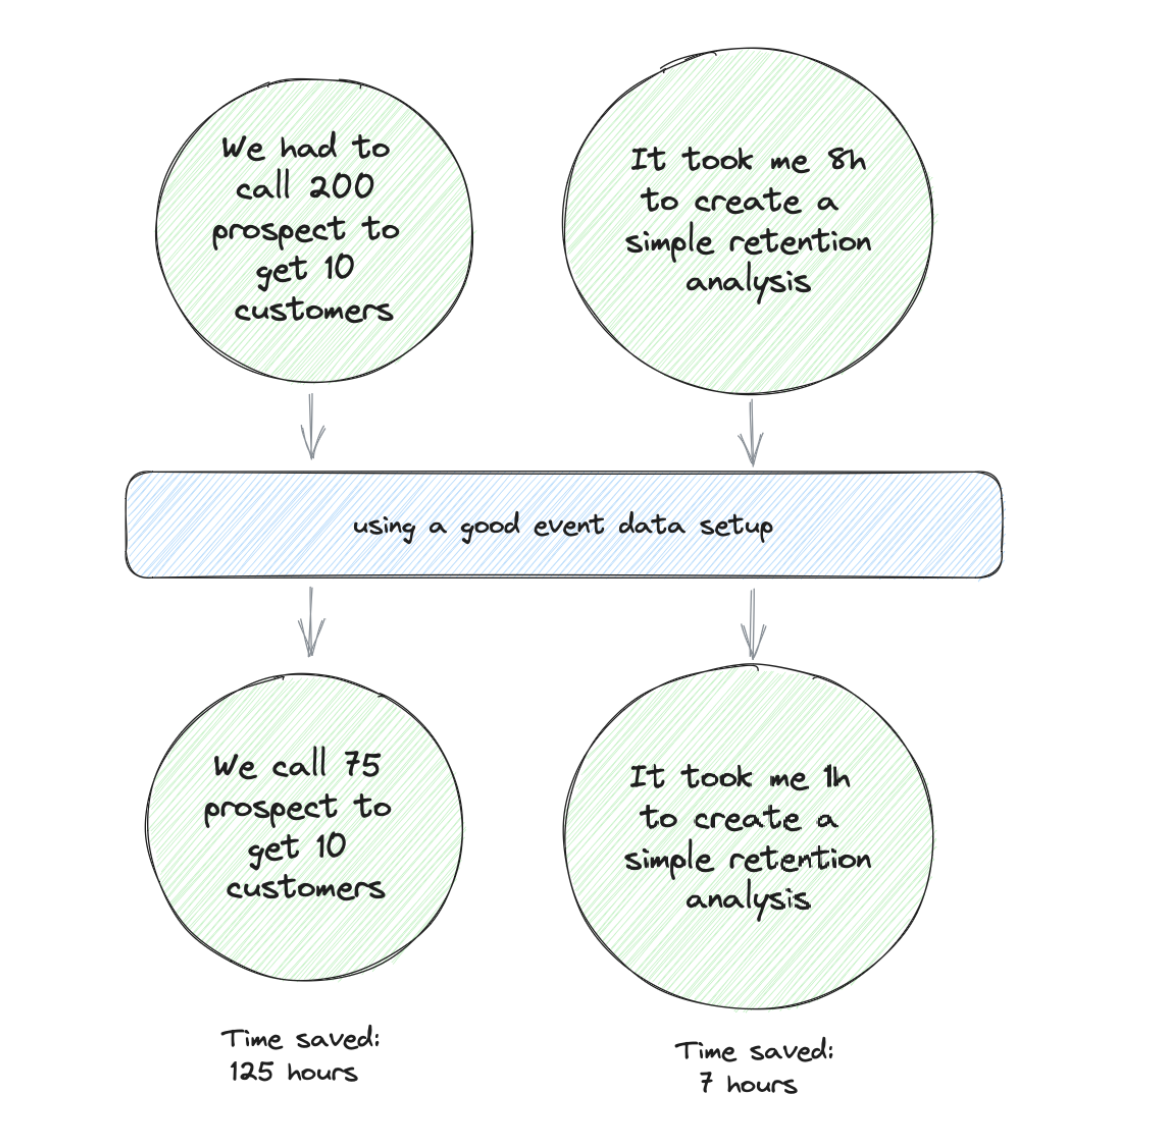
We already had the unpromising leads example, and the counter-one in the revenue category is also a time-saving impact. By flagging potential and unpromising leads, you help the sales team focus their time on things that make an impact.
A good event data setup can also be a time-saver for analysts. This becomes transparent when you invest in the refactoring of a data setup. Let’s assume that an analyst had to do plenty of cross-checks in the old and confusing setup to find the right events for a retention analysis. This can take several days in the worst case. Now, see an analyst in a well-designed setup where they no longer need cross-checks and can do the analysis in 2h.
Your interviews are the best source to discover time savers. Listen carefully for wins where people were speeding up insights and processes with the data. Also, listen carefully when teams describe their work and processes to find opportunities to speed up things with data.
The Technology Dimension
We are coming into the dimension that works mostly by automated metrics. But it is a dangerous one. If you only focus on this one, you do data for data’s sake and risk providing no value. Therefore, the customer and business categories are more important to me, and the technology category supports them.
We are looking at this: Does our setup and process support all teams working with data to get the most from it? Can we react to changes quickly to support an evolution of the setup without creating a mess?
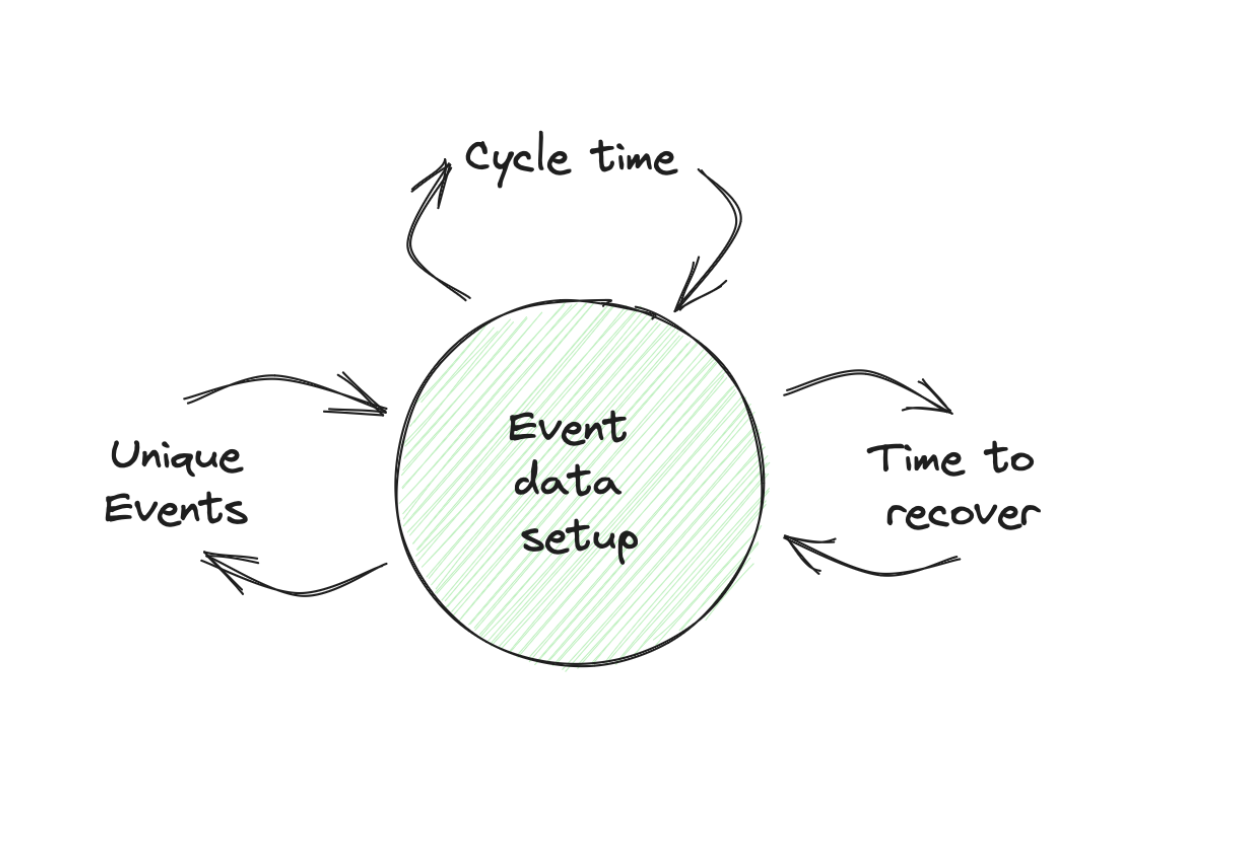
Cycle Time
Often underestimated, but I really like this one. This is the time from when a ticket about an event data change is issued until it gets deployed in production and is accepted by the ticket opener.
This metric gives you insights into how well you are at evolving your event data setup. When your avg. cycle time is 4-6 weeks, you have a serious problem reacting to setup improvements, and I would communicate to all stakeholders that you can only work on a minimum data set.
Time to Recovery
Measures the average time it takes you when a bug in the setup is reported and a fix is in production and accepted. You can even extend it to use the time when the error was introduced as the start time. This also gives you an insight into how good you are at catching errors.
It also makes sense to track the metric of total data issues introduced as well.
Unique Events
This number is my love child since I am convinced that too many unique events are slowing an organization down in all aspects (setup, maintenance, working with the data).
So what is a good number? It depends on the business and product, but I get nervous if you get beyond 40 unique events. Use this metric as an indicator.
You come to 80 unique events, but this doesn’t mean everything is exploding immediately. But you should look more carefully if you see indications in other areas, like longer time to recovery, more data issues after deployment, people struggling to work with the data because they don’t find the right one, and missing or outdated documentation.
2.5 The Survey & Interview Process
The Survey
I recommend starting with the survey. It is a short one based on the product market fit survey that Superhuman used when developing their email client. I like this one more since it has a better PMF question than an NPS score.
The first job of the survey is to give you some structured data that you can use to create an evolution chart. The other job of the survey is to find interview opportunities to dive deeper.
There are different approaches for how often to send the survey. One time a year would be a too-long span for me. Better once a quarter.
The Survey Questions
I would start with these questions:
-
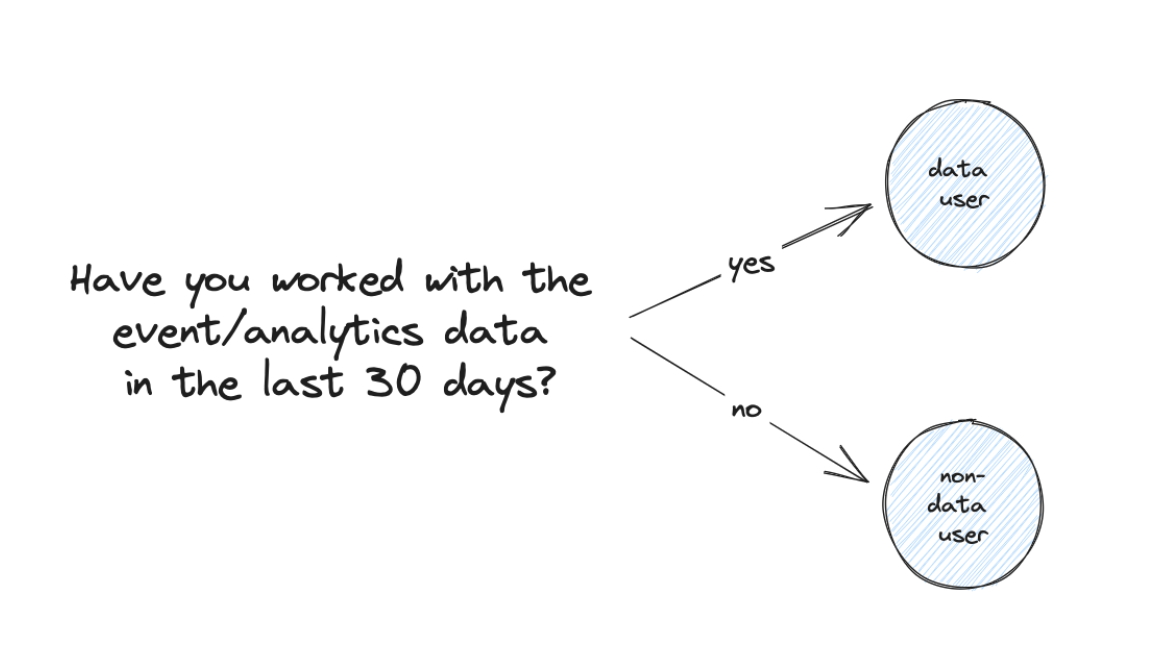
Have you worked with the event/analytics data in the last 30 days? → Yes, No
-
If you don’t work with data, can you give me 2-3 bullet points about why it has no value for you?
-
How disappointed would you be if we stopped providing event/analytics data? → Very disappointed, somewhat disappointed, not disappointed
-
How much do you trust the data? → Full trust (I add the charts directly into my presentations), Mostly trusted (I sometimes do cross-checks), I am careful (before I send them around, I do quite some cross-checks), I don’t trust the data
-
How can we improve your event data/analytics setup?
-
What is your main use case and benefit you can get from the event data/analytics setup?
How to Analyze the Survey
The first question is important to segment the recipients into two segments: data users and non-users. You can add this as a metric to the tracking sheet. But it is tricky since it depends highly on who is answering the survey. So, it is optional.
From the second one, we can generate a very disappointed / all data users ratio. This is a number you can add to the tracking sheet and it will become a core metric for you.
From the third one we can also create a ratio. I would even do two: full trust / data users, mostly trusted / data users. Add them to the tracking sheet.
For the final two questions, you can also add critical takeaways to the tracking sheet to collect them over time. Additionally, they are a good source to choose your interview partners.
What If You Have a Very Low Answer Rate?
Everyone has something else to do than answer the survey.
First, make sure that you outline the benefit of the survey (help to improve their work with data) and that it takes 5 minutes to answer it.
Send the survey notification in different formats (email, Slack, …) and at least 2-3 times as a reminder.
You can work with a benefit. (You will sit down with the winner for two hours and help them review their questions). This might work, but it really needs to provide a real benefit.
The Interview
Interviewing your customers about how they work with event data is one tricky thing. Few people admit in a professional environment that they can’t get any value from the data setup or are struggling to work with it.
So questions like “How long have you spent in our analytics tool?” won’t get you good insights.
The “I Do Not Work with Data” Track
This one is equally important as the other one since this is your acquisition channel. You want to get as many people as possible working with event data. Here, you can learn what needs to be added for them to get started.
This is what the questions are about. We want to understand why this person is not working with event data. They will have some quick answers, but it is worth diving deeper and understanding what tasks they do regularly and where data could help.
You can achieve that by asking them what they were doing in the last seven days and what tasks take up a lot of time and headaches in a regular month.
Knowing they cannot tell you where event data can help is important. This is your job to identify opportunities based on their regular tasks. It takes some practice to spot these, but it is much easier than it sounds.
The “I Work with Data” Track
Here, we investigate how our current setup helps people do a better job and what is holding them back.
We start by letting them recall how they work with data by asking them about the last time they used event data in their work. Here, we really want to get into all the details (as far as they can remember). Start with the initial motivation. What was the question or thought they wanted to investigate? Then, let them recall how they approached it and got their results. Ask for things that took long or were complicated. And finally, when you get to the end, ask what they did with the results.
We ask for more details about these results. It is the same approach, but this time for really helpful insights. You don’t need to go into too many details but try to learn the initial idea or question, how long the analysis took, the obstacles, and how the result helped the person and the company.
We then finish the interview with shorter questions about what is missing for them and where they have problems. These are the items for your idea backlog that you can do to improve their work.
The final question is: “For whom do they think the event data is also useful?” This is an interesting one; in my experience, it can deliver interesting insights. It’s an insight into which audiences you can support better and maybe also interview.
The Tracking Sheet and Process
I recommend you run the survey every quarter, ideally with the same recipient group. Be bold and ask the whole company. In an ideal world, all of them can get value from the data.
Try to conduct 1-2 interviews every month. This keeps you in touch with your users’ daily work and challenges. And these interviews can be very motivational.
Use the tracking sheet template to create your event data setup reporting. This document will be your life-saver whenever someone asks about the benefits of the data setup. The lists of wins, blockers, trust issues, and use cases will be an extremely valuable resource for all future activities.
![]()
![]()
![]()
✏️ Exercise: Set Up Your Measurement Process
Step 1: Prepare the setup monitoring
- Get a copy of the tracking sheet template
- Go to your calendar and add these repeating entries:
- One 2h slot at the beginning of each quarter to prepare the survey and send it out
- One 2h slot each month you block for doing an interview
Step 2: Do the initial survey
- We don’t want to wait for the next quarter to start; we want some data right now. So, let’s establish a baseline immediately.
- Prepare a short message outlining the benefit
- After four days, send a short reminder and do the same after three days again
- After you have closed the survey, analyze the responses
Step 3: First interview
- Create a list of all teams working with the data currently or asking for data insights
- Prioritize it based on the impact you think data makes in their work
- Reach out to the top ones and find a timeslot
- After the interview, summarize: Trust issues, What works good, Wins, Frustrations, Blockers, Use case candidates
Step 4: Repeat
- Do the survey every quarter, do one interview every month
- Derive 2-3 tasks every quarter from it
- Implement the improvements and watch how they help
🎯 Key Takeaways
Module 2 Summary: Strategy & Measurement
-
The five steps to event data nirvana: Design → Process & Implementation → Monitoring & Testing → Ownership → Evolution. All steps require effort, but they create the value that justifies it.
-
Connect to business strategy: Your data strategy must align with business goals. Only things connected to business strategy are valid — if you can’t map it to a business goal, it’s not worth doing.
-
Derive data goals from business goals: This gives you focus (only relevant goals) and makes communication easy (show how you support their efforts to get resources).
-
Measure your setup across three dimensions:
- Customer dimension: Wins, blockers, trust, use cases (qualitative)
- Business dimension: Revenue impact, cost impact, time savings (hard to attribute)
- Technology dimension: Cycle time, time to recovery, unique events (quantitative)
-
Run surveys quarterly and interviews monthly: Use the PMF-style survey to track disappointment and trust ratios. Use JTBD-style interviews to understand how people actually work with data.
-
Track your metrics over time: The “very disappointed” ratio is your PMF metric. Trust ratios alert you to underlying problems. Unique events beyond 40 should make you nervous.